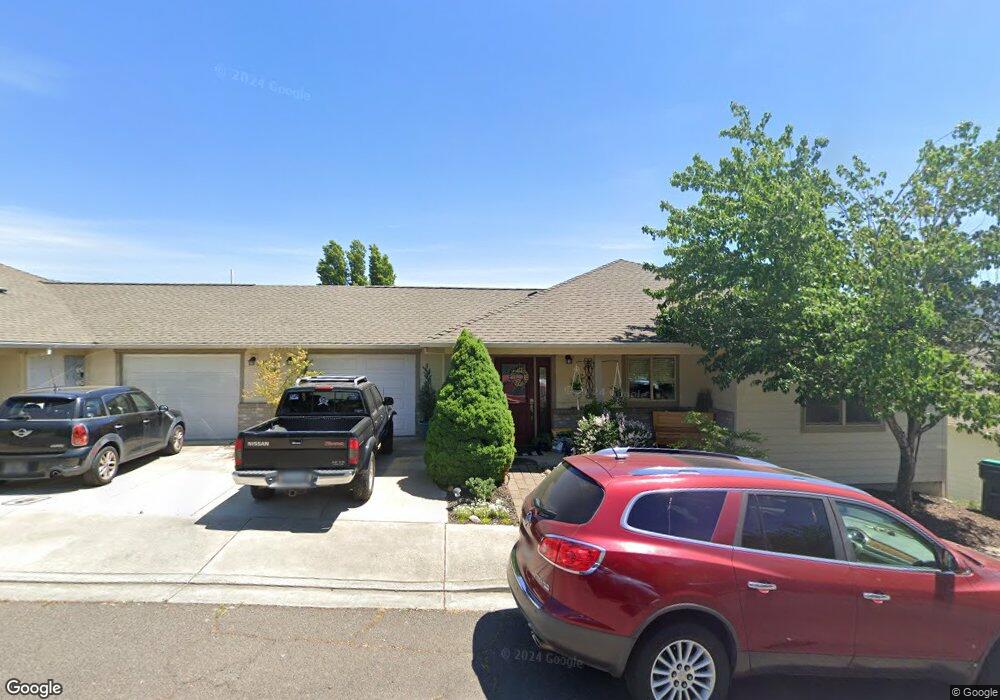
473 Elm St Phoenix, OR 97535
Estimated Value: $496,000 - $541,000
4
Beds
3
Baths
2,648
Sq Ft
$194/Sq Ft
Est. Value
About This Home
This home is located at 473 Elm St, Phoenix, OR 97535 and is currently estimated at $513,058, approximately $193 per square foot. 473 Elm St is a home located in Jackson County with nearby schools including Phoenix Elementary School, Talent Middle School, and Phoenix High School.
Ownership History
Date
Name
Owned For
Owner Type
Purchase Details
Closed on
Oct 2, 2009
Sold by
Federal National Mortgage Association
Bought by
Jump Joshua L
Current Estimated Value
Home Financials for this Owner
Home Financials are based on the most recent Mortgage that was taken out on this home.
Original Mortgage
$233,923
Interest Rate
4.88%
Mortgage Type
VA
Purchase Details
Closed on
Jun 5, 2009
Sold by
Barnhardt Rebecca F
Bought by
Federal National Mortgage Association
Purchase Details
Closed on
Jul 22, 2004
Sold by
California Townhouses
Bought by
Circle T Construction
Create a Home Valuation Report for This Property
The Home Valuation Report is an in-depth analysis detailing your home's value as well as a comparison with similar homes in the area
Home Values in the Area
Average Home Value in this Area
Purchase History
| Date | Buyer | Sale Price | Title Company |
|---|---|---|---|
| Jump Joshua L | $229,000 | Ticor Title | |
| Federal National Mortgage Association | $370,065 | Ticor Title | |
| Circle T Construction | $100,000 | Lawyers Title Ins |
Source: Public Records
Mortgage History
| Date | Status | Borrower | Loan Amount |
|---|---|---|---|
| Previous Owner | Jump Joshua L | $233,923 |
Source: Public Records
Tax History
| Year | Tax Paid | Tax Assessment Tax Assessment Total Assessment is a certain percentage of the fair market value that is determined by local assessors to be the total taxable value of land and additions on the property. | Land | Improvement |
|---|---|---|---|---|
| 2026 | $5,613 | $323,180 | -- | -- |
| 2025 | $5,471 | $313,770 | $65,990 | $247,780 |
| 2024 | $5,471 | $304,640 | $64,070 | $240,570 |
| 2023 | $5,292 | $295,770 | $62,200 | $233,570 |
| 2022 | $5,147 | $295,770 | $62,200 | $233,570 |
| 2021 | $4,957 | $287,160 | $60,390 | $226,770 |
| 2020 | $4,830 | $278,800 | $58,630 | $220,170 |
| 2019 | $4,726 | $262,800 | $55,270 | $207,530 |
| 2018 | $4,588 | $255,150 | $53,660 | $201,490 |
| 2017 | $4,357 | $255,150 | $53,660 | $201,490 |
| 2016 | $4,228 | $240,510 | $50,580 | $189,930 |
| 2015 | $4,069 | $235,380 | $85,220 | $150,160 |
| 2014 | $3,583 | $210,960 | $60,800 | $150,160 |
Source: Public Records
Map
Nearby Homes
- 817 Amerman Dr
- 4624 S Pacific Hwy Unit 23
- 4729 S Pacific Hwy Unit 4
- 4729 S Pacific Hwy Unit 16
- 4729 S Pacific Hwy Unit 24
- 130 Sharon Dr
- 3459 S Pacific Hwy
- 0 Colver Rd
- 300 Luman Rd Unit 197
- 300 Luman Rd Unit 200
- 215 S C St
- 113 Skyler Ln
- 130 Rhonda Ln
- 316 W 3rd St
- 113 Houston Rd
- 510 N Main St
- 600 N Main St
- 610 N Main St Unit 5A
- 612 N Main St
- 88 Mountain View Dr
- 475 Elm St
- 471 Elm St
- 477 Elm St
- 477 Elm Lot 28
- 469 Elm St
- 474 Elm St
- 472 Elm St Unit 9
- 472 Elm St
- 478 Elm St
- 470 Elm St
- 467 Elm St
- 479 Elm St
- 468 Elm St Unit 8
- 468 Elm St
- 0 Pioneer Rd Unit 100200995
- 0 Hummingbird Ln Unit 100257193
- 0 Hummingbird Ln Unit 100252372
- 0 Hummingbird Ln Unit 100242577
- 0 Hummingbird Ln Unit 100242573
- 0 Hummingbird Ln Unit 100242575
Your Personal Tour Guide
Ask me questions while you tour the home.