Estimated Value: $796,000 - $1,140,000
3
Beds
3
Baths
2,220
Sq Ft
$410/Sq Ft
Est. Value
About This Home
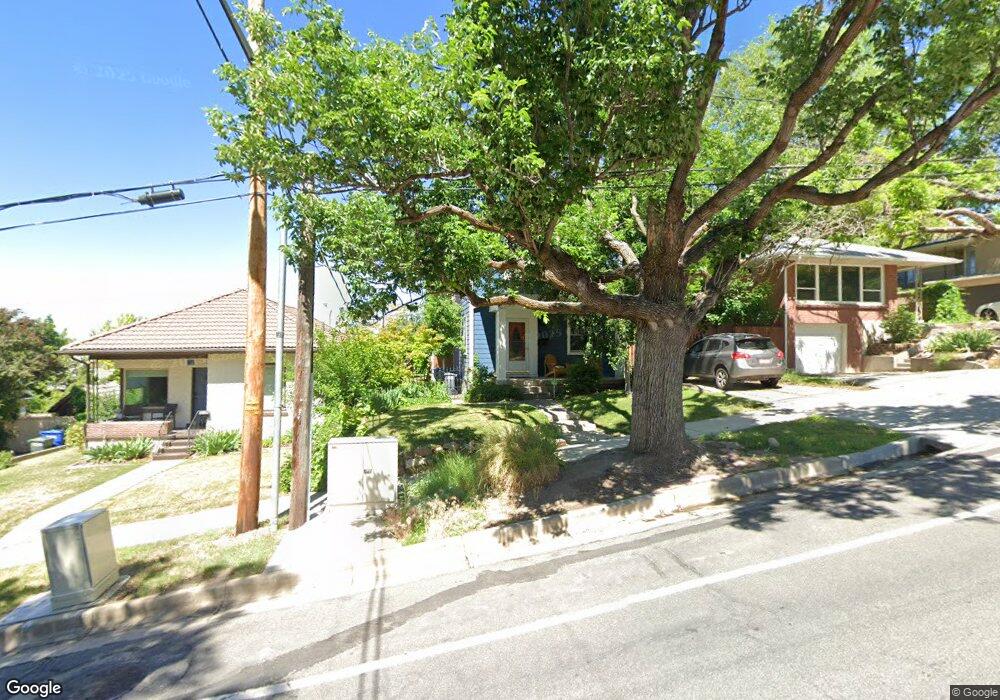
This home is located at 473 I St, Salt Lake City, UT 84103 and is currently estimated at $910,931, approximately $410 per square foot. 473 I St is a home located in Salt Lake County with nearby schools including Ensign School, West High, and Open Classroom.
Ownership History
Date
Name
Owned For
Owner Type
Purchase Details
Closed on
Nov 13, 2024
Sold by
Reyes Roberto
Bought by
Roberto Reyes Fontanez Living Trust and Fontanez
Current Estimated Value
Purchase Details
Closed on
Oct 27, 2009
Sold by
Richards Rebecca J
Bought by
Lazerus G S and G S Lazerus Living Trust
Purchase Details
Closed on
May 20, 2008
Sold by
Richards Rebecca J and Richards Scott J
Bought by
Richards Rebecca J
Purchase Details
Closed on
Oct 11, 2006
Sold by
Maus Paul A and Maus Maureen G
Bought by
Richards Scott J and Richards Rebecca Jo
Create a Home Valuation Report for This Property
The Home Valuation Report is an in-depth analysis detailing your home's value as well as a comparison with similar homes in the area
Home Values in the Area
Average Home Value in this Area
Purchase History
| Date | Buyer | Sale Price | Title Company |
|---|---|---|---|
| Roberto Reyes Fontanez Living Trust | -- | None Listed On Document | |
| Roberto Reyes Fontanez Living Trust | -- | None Listed On Document | |
| Lazerus G S | -- | First American Title Park Ci | |
| Richards Rebecca J | -- | None Available | |
| Richards Scott J | -- | Landmark Title |
Source: Public Records
Tax History Compared to Growth
Tax History
| Year | Tax Paid | Tax Assessment Tax Assessment Total Assessment is a certain percentage of the fair market value that is determined by local assessors to be the total taxable value of land and additions on the property. | Land | Improvement |
|---|---|---|---|---|
| 2025 | $4,110 | $902,200 | $257,100 | $645,100 |
| 2024 | $4,110 | $784,200 | $245,400 | $538,800 |
| 2023 | $4,164 | $765,800 | $236,000 | $529,800 |
| 2022 | $4,582 | $790,600 | $206,700 | $583,900 |
| 2021 | $3,944 | $616,200 | $167,800 | $448,400 |
| 2020 | $3,898 | $579,600 | $156,800 | $422,800 |
| 2019 | $4,061 | $568,200 | $146,800 | $421,400 |
| 2018 | $3,934 | $536,000 | $146,800 | $389,200 |
| 2017 | $4,100 | $523,300 | $146,800 | $376,500 |
| 2016 | $4,128 | $500,300 | $139,900 | $360,400 |
| 2015 | $3,950 | $453,800 | $129,200 | $324,600 |
| 2014 | $4,005 | $456,400 | $128,700 | $327,700 |
Source: Public Records
Map
Nearby Homes