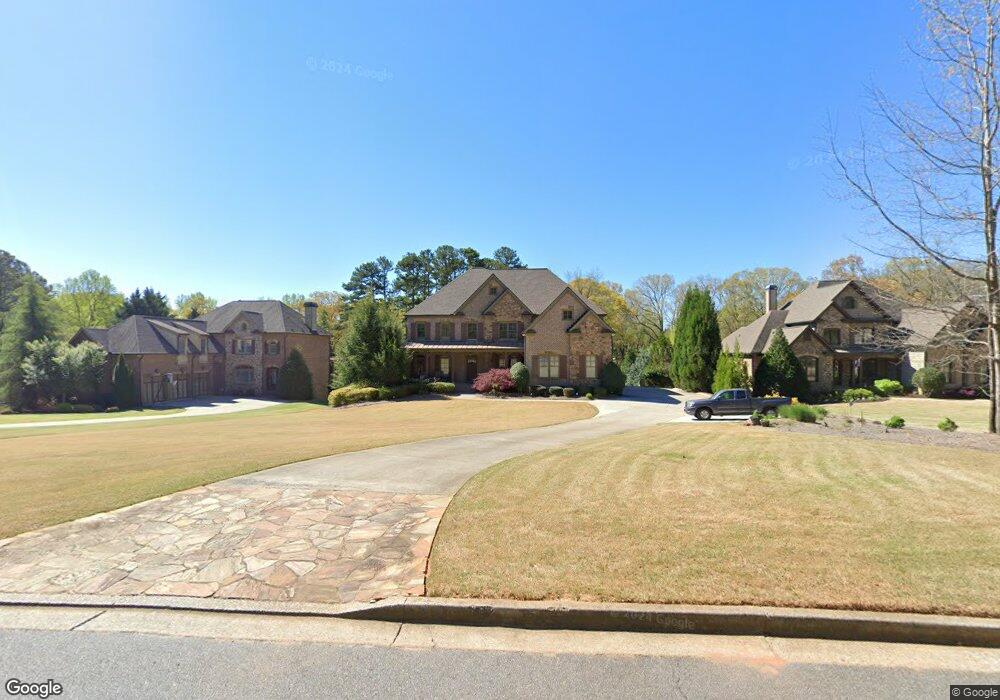
473 Mcginnis Way Unit LOT 7 Alpharetta, GA 30004
Estimated Value: $1,214,109 - $1,743,000
5
Beds
6
Baths
4,753
Sq Ft
$301/Sq Ft
Est. Value
About This Home
This home is located at 473 Mcginnis Way Unit LOT 7, Alpharetta, GA 30004 and is currently estimated at $1,429,527, approximately $300 per square foot. 473 Mcginnis Way Unit LOT 7 is a home located in Fulton County with nearby schools including Summit Hill Elementary School, Hopewell Middle School, and Cambridge High School.
Ownership History
Date
Name
Owned For
Owner Type
Purchase Details
Closed on
Jul 9, 2014
Sold by
Morningstar Luxury Homes Llc
Bought by
Reddy Shyla and Reddy V
Current Estimated Value
Home Financials for this Owner
Home Financials are based on the most recent Mortgage that was taken out on this home.
Original Mortgage
$572,900
Outstanding Balance
$438,009
Interest Rate
4.26%
Mortgage Type
New Conventional
Estimated Equity
$991,518
Purchase Details
Closed on
Nov 15, 2013
Sold by
Community & Southern Bank
Bought by
Morningstar Luxury Homes Llc
Purchase Details
Closed on
May 3, 2011
Sold by
Read Residential Llc
Bought by
Appalachian Cmnty Bk
Purchase Details
Closed on
Feb 22, 2008
Sold by
Mcginnis Farm Dev Llc
Bought by
Read Residential Llc
Home Financials for this Owner
Home Financials are based on the most recent Mortgage that was taken out on this home.
Original Mortgage
$600,000
Interest Rate
5.63%
Create a Home Valuation Report for This Property
The Home Valuation Report is an in-depth analysis detailing your home's value as well as a comparison with similar homes in the area
Home Values in the Area
Average Home Value in this Area
Purchase History
| Date | Buyer | Sale Price | Title Company |
|---|---|---|---|
| Reddy Shyla | $716,215 | -- | |
| Morningstar Luxury Homes Llc | $585,880 | -- | |
| Appalachian Cmnty Bk | -- | -- | |
| Read Residential Llc | $225,000 | -- |
Source: Public Records
Mortgage History
| Date | Status | Borrower | Loan Amount |
|---|---|---|---|
| Open | Reddy Shyla | $572,900 | |
| Previous Owner | Read Residential Llc | $600,000 |
Source: Public Records
Tax History Compared to Growth
Tax History
| Year | Tax Paid | Tax Assessment Tax Assessment Total Assessment is a certain percentage of the fair market value that is determined by local assessors to be the total taxable value of land and additions on the property. | Land | Improvement |
|---|---|---|---|---|
| 2025 | $1,605 | $338,280 | $56,480 | $281,800 |
| 2023 | $9,548 | $338,280 | $56,480 | $281,800 |
| 2022 | $8,900 | $338,280 | $56,480 | $281,800 |
| 2021 | $8,911 | $328,440 | $54,840 | $273,600 |
| 2020 | $9,020 | $324,560 | $54,200 | $270,360 |
| 2019 | $1,696 | $318,800 | $53,240 | $265,560 |
| 2018 | $8,787 | $311,320 | $52,000 | $259,320 |
| 2017 | $8,357 | $286,448 | $47,848 | $238,600 |
| 2016 | $8,359 | $286,450 | $47,850 | $238,600 |
| 2015 | $8,286 | $286,450 | $47,850 | $238,600 |
| 2014 | $7,800 | $299,360 | $50,000 | $249,360 |
Source: Public Records
Map
Nearby Homes
- 16050 Thompson Rd
- 125 Hopewell Grove Dr
- 125 Crabapple Way
- 15785 S Thompson Rd
- 2053 Magnolia Ln Unit 10
- 14710 Creek Club Dr
- 2060 Magnolia Ln Unit 8
- 15794 S Thompson Rd
- 15792 S Thompson Rd
- 2050 Magnolia Ln
- 14492 Club Cir
- 615 Watboro Hill Dr
- 2033 Magnolia Ln
- 630 Greenview Terrace
- 2030 Magnolia Ln
- 465 Majestic Cove
- 585 Watboro Hill Dr
- 515 Watboro Hill Dr
- 473 Mcginnis Way
- 473 Mcginnis Way Unit LOT 7
- 473 Mcginnis Way
- 483 Mcginnis Way Unit LOT 8
- 483 Mcginnis Way
- 463 Mcginnis Way Unit 6
- 463 Mcginnis Way
- 0 Mcginnis Way Unit 7458992
- 0 Mcginnis Way Unit 8652635
- 0 Mcginnis Way Unit 8183601
- 0 Mcginnis Way Unit 8541567
- 0 Mcginnis Way Unit 7148678
- 0 Mcginnis Way
- 453 Mcginnis Way
- 16055 Thompson Rd
- 443 Mcginnis Way
- 443 Mcginnis Way
- 15985 Thompson Rd
- 16040 Thompson Rd
- 433 Mcginnis Way