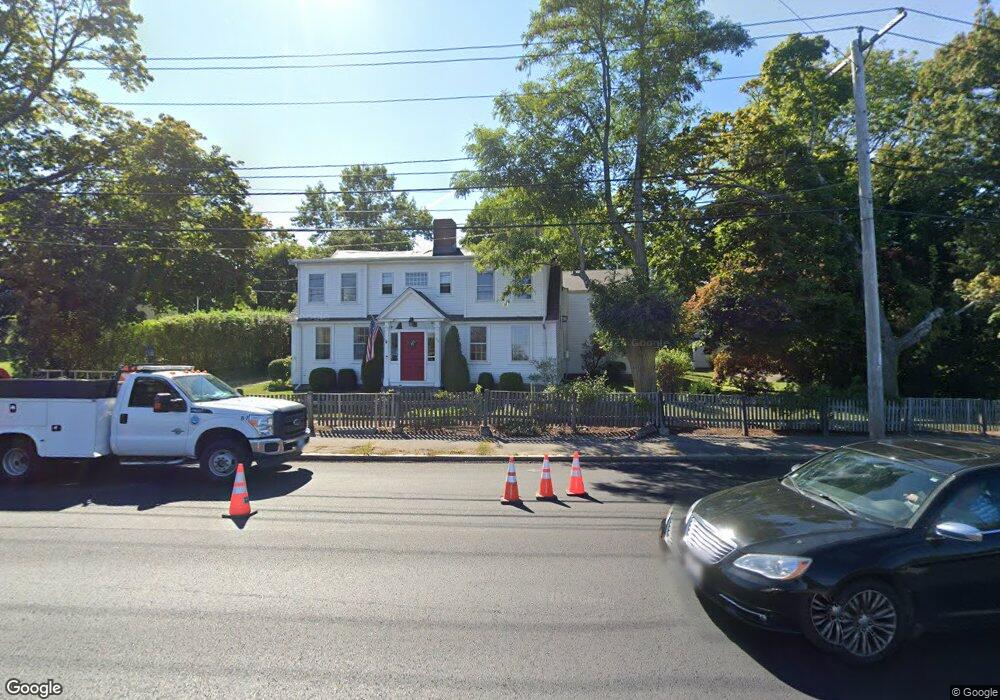
473 Middle St East Weymouth, MA 02189
Estimated Value: $807,111 - $1,017,000
5
Beds
3
Baths
4,271
Sq Ft
$218/Sq Ft
Est. Value
About This Home
This home is located at 473 Middle St, East Weymouth, MA 02189 and is currently estimated at $930,528, approximately $217 per square foot. 473 Middle St is a home located in Norfolk County with nearby schools including William Seach Elementary School, Abigail Adams Middle School, and Weymouth Middle School Chapman.
Ownership History
Date
Name
Owned For
Owner Type
Purchase Details
Closed on
Oct 22, 1993
Sold by
Nash Extr Harold B
Bought by
Andrews Richard P and Andrews Patti J
Current Estimated Value
Home Financials for this Owner
Home Financials are based on the most recent Mortgage that was taken out on this home.
Original Mortgage
$156,800
Interest Rate
6.73%
Mortgage Type
Purchase Money Mortgage
Create a Home Valuation Report for This Property
The Home Valuation Report is an in-depth analysis detailing your home's value as well as a comparison with similar homes in the area
Home Values in the Area
Average Home Value in this Area
Purchase History
| Date | Buyer | Sale Price | Title Company |
|---|---|---|---|
| Andrews Richard P | $115,000 | -- |
Source: Public Records
Mortgage History
| Date | Status | Borrower | Loan Amount |
|---|---|---|---|
| Open | Andrews Richard P | $265,000 | |
| Closed | Andrews Richard P | $160,000 | |
| Closed | Andrews Richard P | $156,800 | |
| Closed | Andrews Richard P | $156,800 |
Source: Public Records
Tax History Compared to Growth
Tax History
| Year | Tax Paid | Tax Assessment Tax Assessment Total Assessment is a certain percentage of the fair market value that is determined by local assessors to be the total taxable value of land and additions on the property. | Land | Improvement |
|---|---|---|---|---|
| 2025 | $7,635 | $755,900 | $252,000 | $503,900 |
| 2024 | $7,381 | $718,700 | $240,000 | $478,700 |
| 2023 | $7,421 | $710,100 | $222,200 | $487,900 |
| 2022 | $7,077 | $617,500 | $196,400 | $421,100 |
| 2021 | $7,099 | $604,700 | $196,400 | $408,300 |
| 2020 | $6,990 | $586,400 | $196,400 | $390,000 |
| 2019 | $6,815 | $562,300 | $188,900 | $373,400 |
| 2018 | $6,575 | $526,000 | $179,900 | $346,100 |
| 2017 | $6,160 | $480,900 | $171,400 | $309,500 |
| 2016 | $6,086 | $475,500 | $164,800 | $310,700 |
| 2015 | $5,774 | $447,600 | $164,800 | $282,800 |
| 2014 | $5,525 | $415,400 | $153,300 | $262,100 |
Source: Public Records
Map
Nearby Homes
- 38 Greenvale Ave
- 58 Lake Shore Dr
- 269 Lake St Unit 5
- 96 Walton St
- 163 Lake St
- 215 Winter St Unit 4L
- 126 Westminster Rd
- 575 Broad St Unit 305
- 575 Broad St Unit 215
- 966 Washington St Unit 2
- 573 Broad St Unit 234
- 16 Oak Cliff Rd
- 85 Whitman St Unit 204
- 19 Saint Margaret St
- 12 Twilight Path
- 29-31 Broad Street Place
- 1015 Washington St
- 286 Broad St
- 460 Front St
- 50 Center St
- 483 Middle St
- 493 Middle St
- 449 Middle St
- 499 Middle St
- 12 Greenwood Ave Unit 1
- 12 Greenwood Ave Unit 12
- 12 Greenwood Ave
- 12 Greenwood Ave
- 14 Greenwood Ave
- 439 Middle St
- 505 Middle St
- 3 Castle Rd
- 11 Castle Rd
- 18 Greenwood Ave
- 511 Middle St
- 28 Greenwood Ave
- 15 Castle Rd
- 24 Greenwood Ave
- 517 Middle St
- 429 Middle St Unit 4