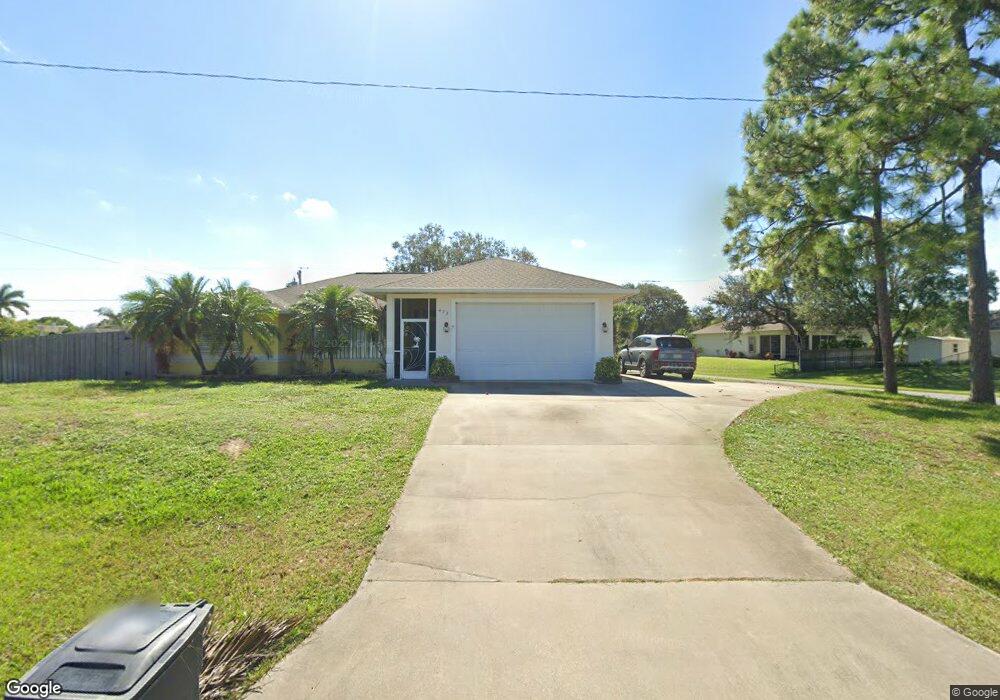
473 Perch Ln Sebastian, FL 32958
Sebastian Highlands NeighborhoodEstimated Value: $413,000 - $466,000
3
Beds
2
Baths
2,070
Sq Ft
$209/Sq Ft
Est. Value
About This Home
This home is located at 473 Perch Ln, Sebastian, FL 32958 and is currently estimated at $431,651, approximately $208 per square foot. 473 Perch Ln is a home located in Indian River County with nearby schools including Sebastian Elementary School, Storm Grove Middle School, and Sebastian River High School.
Ownership History
Date
Name
Owned For
Owner Type
Purchase Details
Closed on
Apr 25, 2025
Sold by
Burns Kathleen M and Norman Kathleen M
Bought by
Norman Bradley L and Norman Kathleen M
Current Estimated Value
Home Financials for this Owner
Home Financials are based on the most recent Mortgage that was taken out on this home.
Original Mortgage
$470,000
Outstanding Balance
$467,914
Interest Rate
6.65%
Mortgage Type
VA
Estimated Equity
-$36,263
Purchase Details
Closed on
Aug 24, 2006
Sold by
Burns Kathleen M and Burns David
Bought by
Burns Kathleen M
Home Financials for this Owner
Home Financials are based on the most recent Mortgage that was taken out on this home.
Original Mortgage
$20,000
Interest Rate
6.58%
Mortgage Type
New Conventional
Purchase Details
Closed on
Jun 7, 2004
Sold by
Hinzman Frank F and Hinzman Patricia C
Bought by
Norman Kathleen M
Home Financials for this Owner
Home Financials are based on the most recent Mortgage that was taken out on this home.
Original Mortgage
$178,900
Interest Rate
6.09%
Mortgage Type
Unknown
Create a Home Valuation Report for This Property
The Home Valuation Report is an in-depth analysis detailing your home's value as well as a comparison with similar homes in the area
Home Values in the Area
Average Home Value in this Area
Purchase History
| Date | Buyer | Sale Price | Title Company |
|---|---|---|---|
| Norman Bradley L | -- | First Source Title | |
| Norman Bradley L | -- | First Source Title | |
| Burns Kathleen M | -- | None Available | |
| Norman Kathleen M | $223,800 | Professional Title |
Source: Public Records
Mortgage History
| Date | Status | Borrower | Loan Amount |
|---|---|---|---|
| Open | Norman Bradley L | $470,000 | |
| Closed | Norman Bradley L | $470,000 | |
| Previous Owner | Burns Kathleen M | $20,000 | |
| Previous Owner | Norman Kathleen M | $178,900 |
Source: Public Records
Tax History Compared to Growth
Tax History
| Year | Tax Paid | Tax Assessment Tax Assessment Total Assessment is a certain percentage of the fair market value that is determined by local assessors to be the total taxable value of land and additions on the property. | Land | Improvement |
|---|---|---|---|---|
| 2024 | $5,717 | $378,660 | $68,567 | $310,093 |
| 2023 | $5,717 | $319,206 | $0 | $0 |
| 2022 | $4,926 | $299,696 | $43,634 | $256,062 |
| 2021 | $4,600 | $263,806 | $39,478 | $224,328 |
| 2020 | $4,349 | $243,649 | $33,244 | $210,405 |
| 2019 | $4,601 | $266,132 | $29,504 | $236,628 |
| 2018 | $4,508 | $269,927 | $24,103 | $245,824 |
| 2017 | $4,030 | $225,587 | $0 | $0 |
| 2016 | $3,813 | $208,420 | $0 | $0 |
| 2015 | $3,505 | $174,950 | $0 | $0 |
| 2014 | $3,122 | $155,960 | $0 | $0 |
Source: Public Records
Map
Nearby Homes
- 493 Quarry Ln
- 491 Bywood Ave
- 457 Candle Ave
- 450 Kendall Ave
- 432 Bywood Ave
- 1060 Carnation Dr
- 915 Rose Arbor Dr
- 410 Watercrest St
- 787 Carnation Dr
- 955 George St
- 789 Sebastian Blvd
- 925 Sebastian Blvd
- 773 Sebastian Blvd
- 342 Perch Ln
- 1018 Persian Ln
- 0 Unassigned (Beard Ave)
- 825 Landsdowne Dr
- 961 George St
- 854 Dale Cir
- 302 Quarry Ln