Estimated Value: $398,000 - $448,478
6
Beds
2
Baths
3,594
Sq Ft
$116/Sq Ft
Est. Value
About This Home
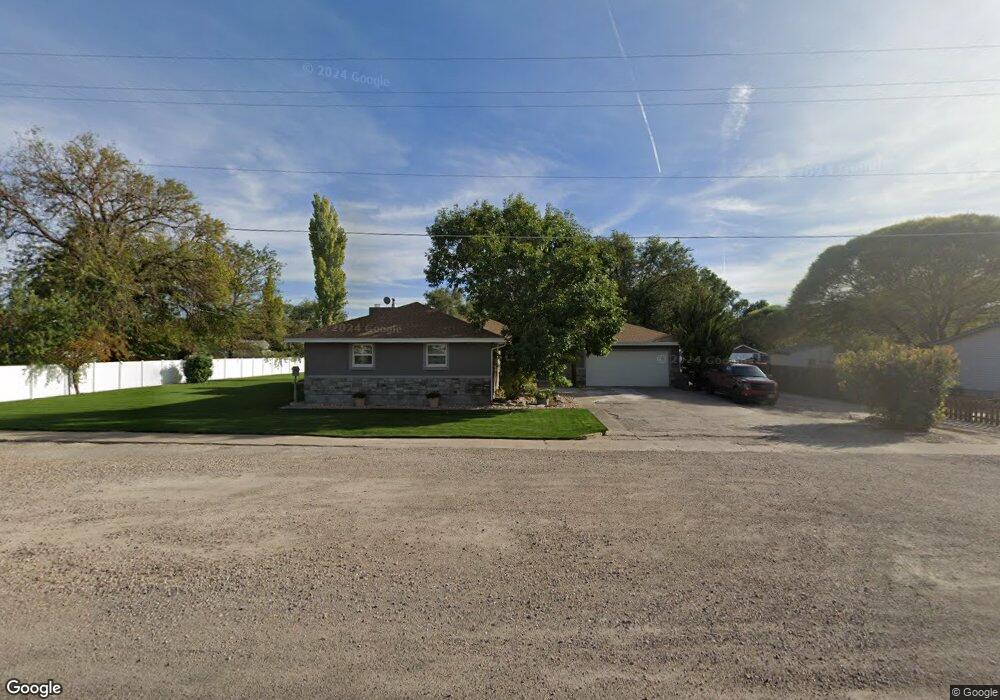
This home is located at 473 W 300 N, Delta, UT 84624 and is currently estimated at $418,620, approximately $116 per square foot. 473 W 300 N is a home located in Millard County with nearby schools including Cba Center and White River Academy.
Ownership History
Date
Name
Owned For
Owner Type
Purchase Details
Closed on
Dec 19, 2011
Sold by
Johnson Jane and Jones Carolyn L
Bought by
Wright Russell D and Wright Shelly
Current Estimated Value
Home Financials for this Owner
Home Financials are based on the most recent Mortgage that was taken out on this home.
Original Mortgage
$132,007
Outstanding Balance
$89,361
Interest Rate
3.87%
Mortgage Type
FHA
Estimated Equity
$329,259
Purchase Details
Closed on
Sep 14, 2010
Sold by
Lyman Louise H and Lyman Louise Hanseb
Bought by
Lyman Louoise H and Johnson Jane
Create a Home Valuation Report for This Property
The Home Valuation Report is an in-depth analysis detailing your home's value as well as a comparison with similar homes in the area
Home Values in the Area
Average Home Value in this Area
Purchase History
| Date | Buyer | Sale Price | Title Company |
|---|---|---|---|
| Wright Russell D | -- | -- | |
| Lyman Louoise H | -- | -- |
Source: Public Records
Mortgage History
| Date | Status | Borrower | Loan Amount |
|---|---|---|---|
| Open | Wright Russell D | $132,007 |
Source: Public Records
Tax History
| Year | Tax Paid | Tax Assessment Tax Assessment Total Assessment is a certain percentage of the fair market value that is determined by local assessors to be the total taxable value of land and additions on the property. | Land | Improvement |
|---|---|---|---|---|
| 2025 | $2,404 | $257,202 | $28,761 | $228,441 |
| 2024 | $2,404 | $222,714 | $8,850 | $213,864 |
| 2023 | $2,700 | $222,714 | $8,850 | $213,864 |
| 2022 | $2,092 | $157,406 | $8,045 | $149,361 |
| 2021 | $1,795 | $128,924 | $6,996 | $121,928 |
| 2020 | $1,434 | $102,330 | $6,360 | $95,970 |
| 2019 | $1,359 | $97,049 | $5,889 | $91,160 |
| 2018 | $1,243 | $89,523 | $5,889 | $83,634 |
| 2017 | $1,288 | $89,351 | $5,717 | $83,634 |
| 2016 | $1,248 | $89,351 | $5,717 | $83,634 |
| 2015 | $1,248 | $89,351 | $5,717 | $83,634 |
| 2014 | -- | $90,058 | $5,717 | $84,341 |
| 2013 | -- | $90,058 | $5,717 | $84,341 |
Source: Public Records
Map
Nearby Homes
- 451 W 300 N
- 325 N 100 W
- 163 W 100 S
- 294 S 300 W
- 98 W 1000 N
- 0 E Highway 6 Unit LotWP001 16586023
- 32 E 300 S
- 38 E 300 S
- 44 E 300 S
- 87 S 300 East Rd
- 321 E 200 S
- 445 Topaz Blvd Unit 10
- 520 E 450 North Rd
- 7900 E 250 Rd N
- 9000 W 1500 Rd N
- 901 E 750 Rd N
- 628 Sunset St
- 625 E Birch Dr
- Locust Ave Unit LotWP001
- 7430 W 3000 N