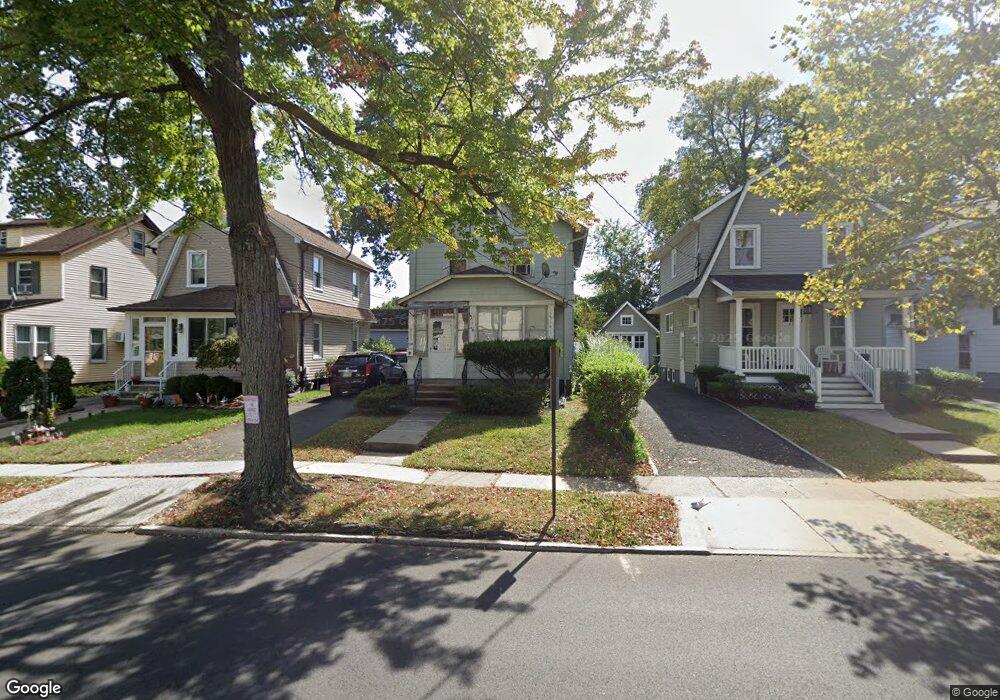
473 W 3rd Ave Roselle, NJ 07203
Estimated Value: $376,365 - $473,000
--
Bed
--
Bath
1,000
Sq Ft
$434/Sq Ft
Est. Value
About This Home
This home is located at 473 W 3rd Ave, Roselle, NJ 07203 and is currently estimated at $434,091, approximately $434 per square foot. 473 W 3rd Ave is a home located in Union County with nearby schools including Washington Elementary School, Leonard V. Moore Middle School, and Grace Wilday Junior High School.
Ownership History
Date
Name
Owned For
Owner Type
Purchase Details
Closed on
Feb 8, 2000
Sold by
Gomez Diego and Gomez Martha L
Bought by
Ocwen Federal Bank Fsb
Current Estimated Value
Purchase Details
Closed on
Jun 17, 1999
Sold by
Cash Donald J
Bought by
Robinson Willie and Robinson Adriana
Home Financials for this Owner
Home Financials are based on the most recent Mortgage that was taken out on this home.
Original Mortgage
$70,200
Interest Rate
10.24%
Create a Home Valuation Report for This Property
The Home Valuation Report is an in-depth analysis detailing your home's value as well as a comparison with similar homes in the area
Home Values in the Area
Average Home Value in this Area
Purchase History
| Date | Buyer | Sale Price | Title Company |
|---|---|---|---|
| Ocwen Federal Bank Fsb | -- | -- | |
| Robinson Willie | $78,000 | First American Title Ins Co |
Source: Public Records
Mortgage History
| Date | Status | Borrower | Loan Amount |
|---|---|---|---|
| Previous Owner | Robinson Willie | $70,200 |
Source: Public Records
Tax History Compared to Growth
Tax History
| Year | Tax Paid | Tax Assessment Tax Assessment Total Assessment is a certain percentage of the fair market value that is determined by local assessors to be the total taxable value of land and additions on the property. | Land | Improvement |
|---|---|---|---|---|
| 2025 | $7,765 | $89,300 | $58,300 | $31,000 |
| 2024 | $7,570 | $89,300 | $58,300 | $31,000 |
| 2023 | $7,570 | $89,300 | $58,300 | $31,000 |
| 2022 | $7,623 | $89,300 | $58,300 | $31,000 |
| 2021 | $7,577 | $89,300 | $58,300 | $31,000 |
| 2020 | $7,553 | $89,300 | $58,300 | $31,000 |
| 2019 | $7,457 | $89,300 | $58,300 | $31,000 |
| 2018 | $7,415 | $89,300 | $58,300 | $31,000 |
| 2017 | $7,376 | $89,300 | $58,300 | $31,000 |
| 2016 | $7,214 | $89,300 | $58,300 | $31,000 |
| 2015 | $7,213 | $89,300 | $58,300 | $31,000 |
| 2014 | $7,012 | $89,300 | $58,300 | $31,000 |
Source: Public Records
Map
Nearby Homes
- 215 Floral St
- 403 John St
- 203 Vine St
- 443 Wheatsheaf Rd
- 457 W 4th Ave
- 201 Sterling Place
- 206 Amsterdam Ave
- 248 W 3rd Ave
- 217 Grace St
- 446 W 6th Ave
- 448 Cristiani St
- 511 Westfield Ave W
- 216 W 6th Ave
- 323 Dermody St
- 133 W 3rd Ave
- 38 Independence Dr
- 13 Independence Dr
- 126 Butler Ave
- 210 W 7th Ave
- 108 110 Warren Ave