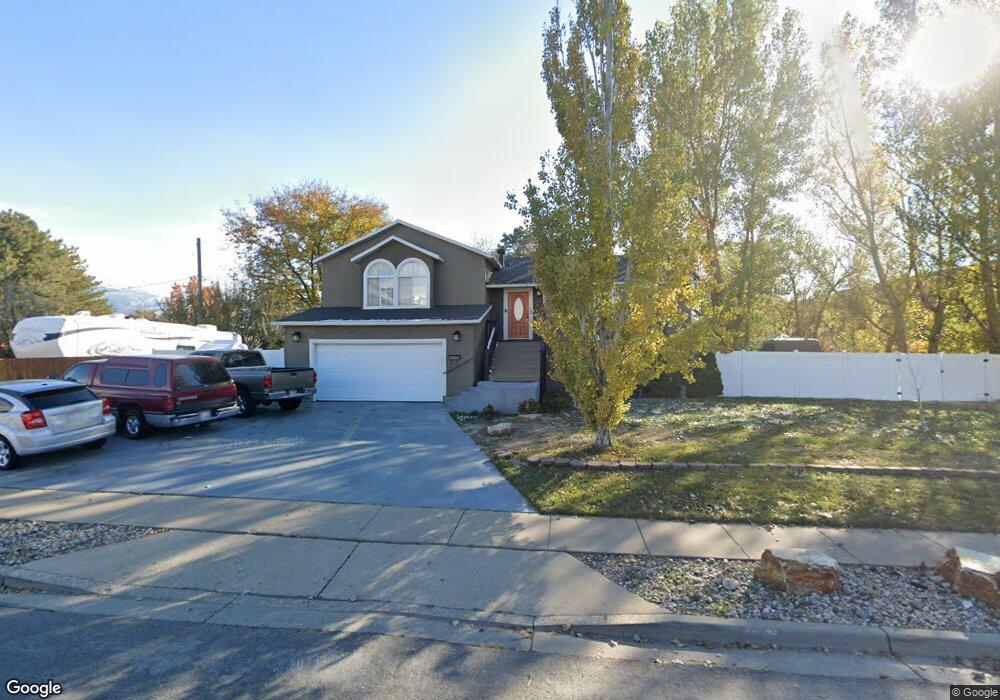
473 W Pages Ln Bountiful, UT 84010
Estimated Value: $537,000 - $599,000
4
Beds
3
Baths
2,564
Sq Ft
$220/Sq Ft
Est. Value
About This Home
This home is located at 473 W Pages Ln, Bountiful, UT 84010 and is currently estimated at $565,137, approximately $220 per square foot. 473 W Pages Ln is a home located in Davis County with nearby schools including Meadowbrook Elementary School, Bountiful Junior High School, and Viewmont High School.
Ownership History
Date
Name
Owned For
Owner Type
Purchase Details
Closed on
Oct 20, 2017
Sold by
Romero Buddy and Romero Rose
Bought by
Romero Buddy A and Romero Rosaelia
Current Estimated Value
Home Financials for this Owner
Home Financials are based on the most recent Mortgage that was taken out on this home.
Original Mortgage
$225,000
Outstanding Balance
$187,736
Interest Rate
3.78%
Mortgage Type
New Conventional
Estimated Equity
$377,401
Purchase Details
Closed on
Sep 27, 2006
Sold by
Hancock Joel J
Bought by
Romero Buddy and Romero Rose
Home Financials for this Owner
Home Financials are based on the most recent Mortgage that was taken out on this home.
Original Mortgage
$209,000
Interest Rate
6.44%
Mortgage Type
New Conventional
Purchase Details
Closed on
Jul 26, 1999
Sold by
Hancock Joel J and Chris Hancock I
Bought by
Hancock Joel J
Home Financials for this Owner
Home Financials are based on the most recent Mortgage that was taken out on this home.
Original Mortgage
$21,600
Interest Rate
7.64%
Mortgage Type
Balloon
Create a Home Valuation Report for This Property
The Home Valuation Report is an in-depth analysis detailing your home's value as well as a comparison with similar homes in the area
Purchase History
| Date | Buyer | Sale Price | Title Company |
|---|---|---|---|
| Romero Buddy A | -- | First American Title | |
| Romero Buddy | -- | First American Title | |
| Hancock Joel J | -- | Meridian Title Company |
Source: Public Records
Mortgage History
| Date | Status | Borrower | Loan Amount |
|---|---|---|---|
| Open | Romero Buddy A | $225,000 | |
| Closed | Romero Buddy | $209,000 | |
| Previous Owner | Hancock Joel J | $21,600 |
Source: Public Records
Tax History
| Year | Tax Paid | Tax Assessment Tax Assessment Total Assessment is a certain percentage of the fair market value that is determined by local assessors to be the total taxable value of land and additions on the property. | Land | Improvement |
|---|---|---|---|---|
| 2025 | $3,171 | $279,400 | $134,906 | $144,494 |
| 2024 | $3,020 | $271,700 | $130,668 | $141,032 |
| 2023 | $2,881 | $471,000 | $288,494 | $182,506 |
| 2022 | $3,034 | $273,350 | $154,401 | $118,949 |
| 2021 | $2,826 | $392,000 | $202,562 | $189,438 |
| 2020 | $2,572 | $344,000 | $168,726 | $175,274 |
| 2019 | $2,684 | $340,000 | $151,491 | $188,509 |
| 2018 | $2,436 | $308,000 | $146,435 | $161,565 |
| 2016 | $2,100 | $142,450 | $58,521 | $83,929 |
| 2015 | $2,106 | $128,315 | $58,521 | $69,794 |
| 2014 | $1,981 | $130,075 | $58,521 | $71,554 |
| 2013 | -- | $118,306 | $35,068 | $83,238 |
Source: Public Records
Map
Nearby Homes
- 1625 Pages Place
- 1520 N 550 W
- 328 W Pages Ln
- 1767 N 600 W
- 235 W 1400 N
- 204 Lyman Ln
- 1260 N 200 W
- 366 W 1000 N
- 951 Centerville Commons Way
- 1130 N 200 W
- 96 Village Square Rd
- 324 S 600 W
- 287 S 680 W Unit 9
- 184 Park Shadows Cir
- 330 W Paradiso Ln
- 16 W 780 S
- 1420 N Main St
- 2093 N 750 W
- 825 W 1320 N
- 967 S Courtyard Ln
Your Personal Tour Guide
Ask me questions while you tour the home.