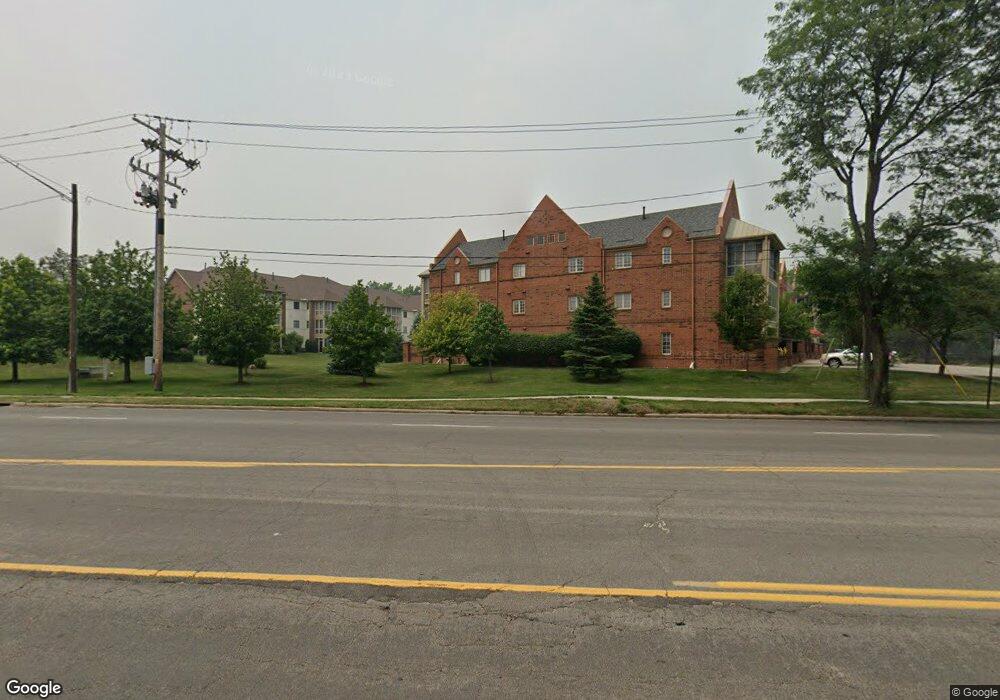
4730 Glendale Ave Unit 107 Toledo, OH 43614
Southwyck NeighborhoodEstimated Value: $144,000 - $187,000
2
Beds
2
Baths
1,253
Sq Ft
$126/Sq Ft
Est. Value
About This Home
This home is located at 4730 Glendale Ave Unit 107, Toledo, OH 43614 and is currently estimated at $157,570, approximately $125 per square foot. 4730 Glendale Ave Unit 107 is a home located in Lucas County with nearby schools including Glendale-Feilbach Elementary School, Bowsher High School, and Northwest Ohio Classical Academy.
Ownership History
Date
Name
Owned For
Owner Type
Purchase Details
Closed on
Aug 21, 2020
Sold by
Rule Marilyn
Bought by
Roso Darlene
Current Estimated Value
Home Financials for this Owner
Home Financials are based on the most recent Mortgage that was taken out on this home.
Original Mortgage
$96,000
Outstanding Balance
$85,159
Interest Rate
3%
Mortgage Type
New Conventional
Estimated Equity
$72,411
Purchase Details
Closed on
Apr 28, 2015
Sold by
Guess Margaret A and Guess Michael G
Bought by
Rule Marilyn
Home Financials for this Owner
Home Financials are based on the most recent Mortgage that was taken out on this home.
Original Mortgage
$62,400
Interest Rate
3.68%
Mortgage Type
New Conventional
Purchase Details
Closed on
May 17, 2011
Sold by
Kohn Gertrude W
Bought by
Guess Margaret A
Create a Home Valuation Report for This Property
The Home Valuation Report is an in-depth analysis detailing your home's value as well as a comparison with similar homes in the area
Home Values in the Area
Average Home Value in this Area
Purchase History
| Date | Buyer | Sale Price | Title Company |
|---|---|---|---|
| Roso Darlene | $105,000 | Louisville Ttl Agcy For N W | |
| Rule Marilyn | $78,000 | Louisville Title Agency For | |
| Guess Margaret A | $57,000 | Chicago Title Insurance Co |
Source: Public Records
Mortgage History
| Date | Status | Borrower | Loan Amount |
|---|---|---|---|
| Open | Roso Darlene | $96,000 | |
| Previous Owner | Rule Marilyn | $62,400 |
Source: Public Records
Tax History Compared to Growth
Tax History
| Year | Tax Paid | Tax Assessment Tax Assessment Total Assessment is a certain percentage of the fair market value that is determined by local assessors to be the total taxable value of land and additions on the property. | Land | Improvement |
|---|---|---|---|---|
| 2024 | $1,461 | $50,540 | $4,690 | $45,850 |
| 2023 | $2,038 | $33,740 | $3,605 | $30,135 |
| 2022 | $2,040 | $33,740 | $3,605 | $30,135 |
| 2021 | $2,102 | $33,740 | $3,605 | $30,135 |
| 2020 | $1,726 | $24,710 | $3,360 | $21,350 |
| 2019 | $1,688 | $24,710 | $3,360 | $21,350 |
| 2018 | $1,250 | $24,710 | $3,360 | $21,350 |
| 2017 | $1,445 | $19,950 | $3,325 | $16,625 |
| 2016 | $1,429 | $57,000 | $9,500 | $47,500 |
| 2015 | $811 | $57,000 | $9,500 | $47,500 |
| 2014 | $705 | $19,960 | $3,330 | $16,630 |
| 2013 | $705 | $19,960 | $3,330 | $16,630 |
Source: Public Records
Map
Nearby Homes
- 1933 Woodlore Dr
- 2020 W Crest Dr
- 4796 Ryan Ridge Place
- 1415 Creekwood Ln
- 2017 Green Valley Dr
- 2155 Bishopsgate Dr
- 4866 Airport Hwy
- 1253 Eastgate Rd
- 1240 Westgate Rd
- 4534 Heathercove Place
- 1518 Cherrylawn Dr
- 5150 Norton Place
- 5035 Norwich Rd
- 4432 Copper Creek Ln
- 4425 Oak Creek Ln
- 2451 Eastgate Rd
- 1553 Heather Meadow Dr
- 3813 Glendale Ave
- 5533 Cresthaven Ln
- 1969 Oaklawn Dr
- 4720 Glendale Ave
- 4720 Glendale Ave
- 4720 Glendale Ave Unit 307
- 4720 Glendale Ave
- 4720 Glendale Ave
- 4720 Glendale Ave
- 4720 Glendale Ave
- 4720 Glendale Ave
- 4720 Glendale Ave Unit 301
- 4720 Glendale Ave
- 4720 Glendale Ave
- 4720 Glendale Ave Unit 207
- 4720 Glendale Ave Unit 206
- 4720 Glendale Ave Unit 204
- 4720 Glendale Ave Unit 203
- 4720 Glendale Ave Unit 202
- 4720 Glendale Ave
- 4720 Glendale Ave
- 4720 Glendale Ave Unit 109
- 4720 Glendale Ave