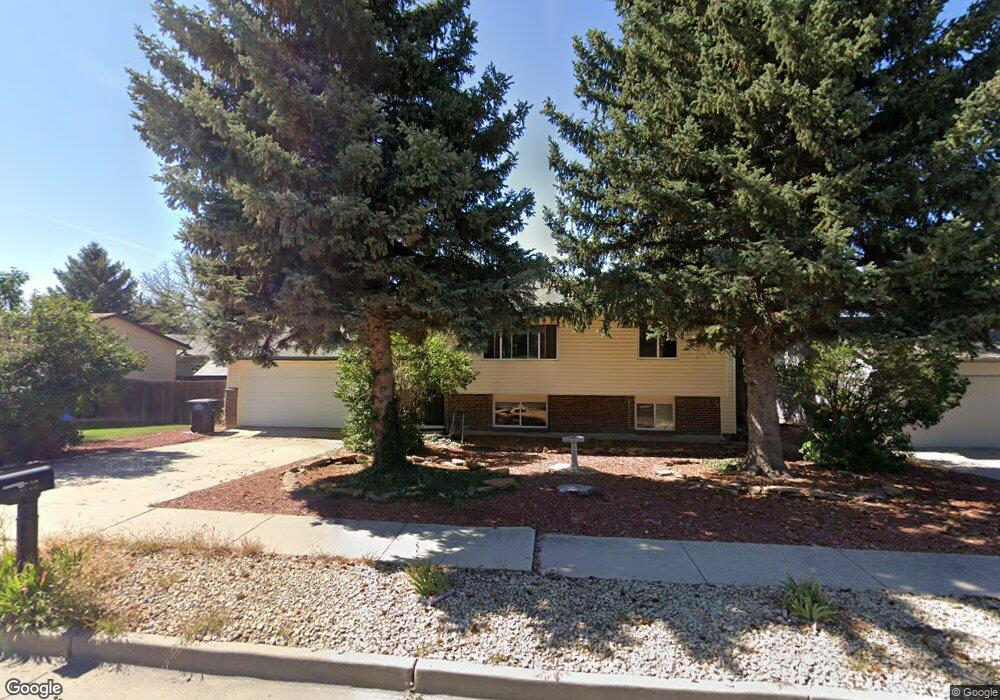
4730 Iron Horse Trail Colorado Springs, CO 80917
Old Farms NeighborhoodEstimated Value: $402,810 - $475,000
4
Beds
2
Baths
874
Sq Ft
$489/Sq Ft
Est. Value
About This Home
This home is located at 4730 Iron Horse Trail, Colorado Springs, CO 80917 and is currently estimated at $427,453, approximately $489 per square foot. 4730 Iron Horse Trail is a home located in El Paso County with nearby schools including Rudy Elementary School, Sabin Middle School, and Doherty High School.
Ownership History
Date
Name
Owned For
Owner Type
Purchase Details
Closed on
Aug 27, 2018
Sold by
Florea Glen Minor and Johnson Karle Jo
Bought by
Kaplan Trevor and Gruen Tatianna
Current Estimated Value
Home Financials for this Owner
Home Financials are based on the most recent Mortgage that was taken out on this home.
Original Mortgage
$261,900
Outstanding Balance
$227,922
Interest Rate
4.5%
Mortgage Type
New Conventional
Estimated Equity
$199,531
Purchase Details
Closed on
Jan 27, 2017
Sold by
Christianson Daisy E and Christianson Carl J
Bought by
Florca Glen Minor and Johnson Karie Jo
Home Financials for this Owner
Home Financials are based on the most recent Mortgage that was taken out on this home.
Original Mortgage
$210,123
Interest Rate
4.5%
Mortgage Type
FHA
Purchase Details
Closed on
Dec 18, 1987
Bought by
Johnson Karie Jo
Purchase Details
Closed on
Jul 1, 1979
Bought by
Johnson Karie Jo
Create a Home Valuation Report for This Property
The Home Valuation Report is an in-depth analysis detailing your home's value as well as a comparison with similar homes in the area
Home Values in the Area
Average Home Value in this Area
Purchase History
| Date | Buyer | Sale Price | Title Company |
|---|---|---|---|
| Kaplan Trevor | $270,000 | Legacy Title Group | |
| Florca Glen Minor | $214,000 | Fidelity National Title | |
| Johnson Karie Jo | -- | -- | |
| Johnson Karie Jo | -- | -- |
Source: Public Records
Mortgage History
| Date | Status | Borrower | Loan Amount |
|---|---|---|---|
| Open | Kaplan Trevor | $261,900 | |
| Previous Owner | Florca Glen Minor | $210,123 |
Source: Public Records
Tax History Compared to Growth
Tax History
| Year | Tax Paid | Tax Assessment Tax Assessment Total Assessment is a certain percentage of the fair market value that is determined by local assessors to be the total taxable value of land and additions on the property. | Land | Improvement |
|---|---|---|---|---|
| 2025 | $1,283 | $27,950 | -- | -- |
| 2024 | $1,171 | $27,500 | $5,490 | $22,010 |
| 2023 | $1,171 | $27,500 | $5,490 | $22,010 |
| 2022 | $1,131 | $20,210 | $4,170 | $16,040 |
| 2021 | $1,227 | $20,790 | $4,290 | $16,500 |
| 2020 | $1,190 | $17,530 | $3,720 | $13,810 |
| 2019 | $1,183 | $17,530 | $3,720 | $13,810 |
| 2018 | $1,110 | $15,130 | $3,240 | $11,890 |
| 2017 | $551 | $15,130 | $3,240 | $11,890 |
| 2016 | $397 | $13,670 | $2,710 | $10,960 |
| 2015 | $395 | $13,670 | $2,710 | $10,960 |
| 2014 | $371 | $12,320 | $2,710 | $9,610 |
Source: Public Records
Map
Nearby Homes
- 4878 S Old Brook Cir
- 4842 S Old Brook Cir
- 4955 Chickweed Dr
- 4774 Bunchberry Ln
- 4504 Bell Flower Dr
- 5210 Coneflower Ln
- 4958 Wood Brook Ct
- 5002 Barnes Rd
- 4652 Excalibur Ct
- 5117 Solar Ridge Dr
- 5183 Solar Ridge Dr
- 4636 Winewood Village Dr
- 4835 W Old Farm Cir
- 5441 E Old Farm Cir
- 5102 Rainbow Harbour Cir
- 5256 Mountain Peak Point
- 5119 Lewisia Point
- 5125 Lewisia Point
- 4336 Adam Mark Point
- 4671 Winewood Village Dr Unit X4671
- 4740 Iron Horse Trail
- 5080 Bluestem Dr
- 5070 Bluestem Dr
- 5075 Chickweed Dr
- 5085 Chickweed Dr
- 4735 Iron Horse Trail
- 5060 Bluestem Dr
- 5110 Bluestem Dr
- 5050 Bluestem Dr
- 5065 Chickweed Dr
- 5115 Thistle Ct
- 4760 Iron Horse Trail
- 4690 Iron Horse Trail
- 5080 Chickweed Dr
- 5120 Bluestem Dr
- 4755 Iron Horse Trail
- 5067 Bluestem Dr
- 5040 Bluestem Dr
- 5055 Chickweed Dr
- 4685 Iron Horse Trail