Estimated Value: $418,000 - $442,000
4
Beds
3
Baths
1,755
Sq Ft
$246/Sq Ft
Est. Value
About This Home
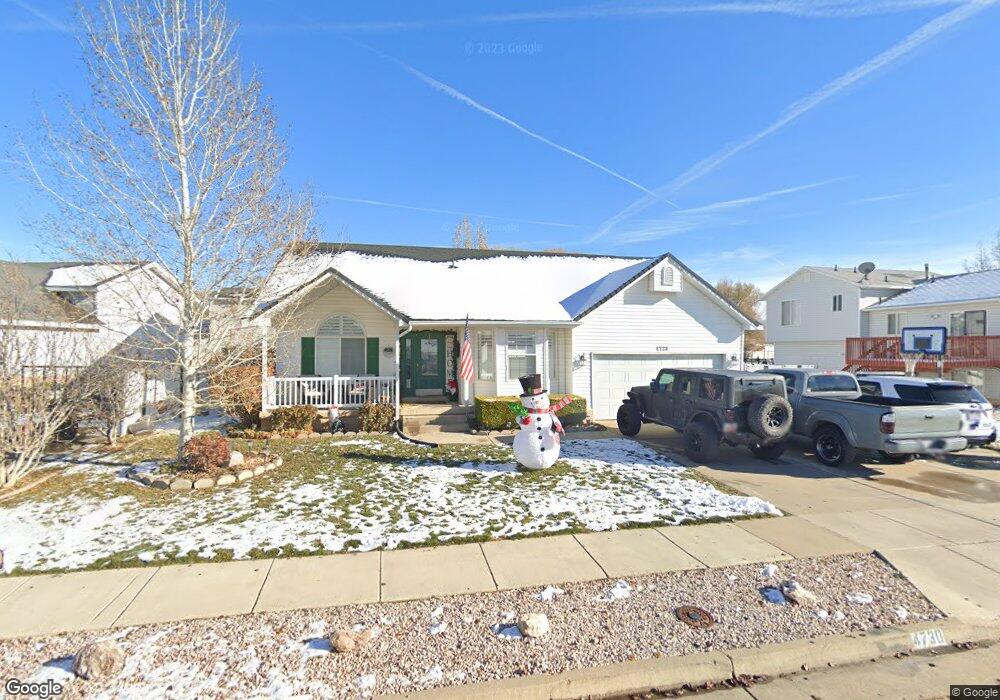
This home is located at 4730 S 3950 W, Roy, UT 84067 and is currently estimated at $431,516, approximately $245 per square foot. 4730 S 3950 W is a home located in Weber County with nearby schools including West Haven School, Sand Ridge Junior High School, and Roy High School.
Ownership History
Date
Name
Owned For
Owner Type
Purchase Details
Closed on
Apr 21, 2023
Sold by
Lobaido John A and Lobaido Ruth Ann
Bought by
John And Ruth Ann Lobaido Living Trust and Lobaido
Current Estimated Value
Purchase Details
Closed on
Sep 11, 2000
Sold by
Hansen Evelyn K
Bought by
Lobaido John A and Lobaido Ruth Ann
Home Financials for this Owner
Home Financials are based on the most recent Mortgage that was taken out on this home.
Original Mortgage
$108,000
Interest Rate
8.11%
Purchase Details
Closed on
Feb 10, 1998
Sold by
Hansen Evelyn K
Bought by
Hansen Evelyn K
Home Financials for this Owner
Home Financials are based on the most recent Mortgage that was taken out on this home.
Original Mortgage
$20,000
Interest Rate
6.98%
Purchase Details
Closed on
Jan 17, 1997
Sold by
Haskell Homes Inc
Bought by
Hansen Evelyn K
Home Financials for this Owner
Home Financials are based on the most recent Mortgage that was taken out on this home.
Original Mortgage
$65,000
Interest Rate
7.58%
Create a Home Valuation Report for This Property
The Home Valuation Report is an in-depth analysis detailing your home's value as well as a comparison with similar homes in the area
Home Values in the Area
Average Home Value in this Area
Purchase History
| Date | Buyer | Sale Price | Title Company |
|---|---|---|---|
| John And Ruth Ann Lobaido Living Trust | -- | None Listed On Document | |
| Lobaido John A | -- | First American Title | |
| Hansen Evelyn K | -- | Centennial Title | |
| Hansen Evelyn K | -- | Security Title | |
| Hansen Evelyn K | -- | Security Title |
Source: Public Records
Mortgage History
| Date | Status | Borrower | Loan Amount |
|---|---|---|---|
| Previous Owner | Lobaido John A | $108,000 | |
| Previous Owner | Hansen Evelyn K | $20,000 | |
| Previous Owner | Hansen Evelyn K | $65,000 | |
| Closed | Lobaido John A | $20,200 |
Source: Public Records
Tax History
| Year | Tax Paid | Tax Assessment Tax Assessment Total Assessment is a certain percentage of the fair market value that is determined by local assessors to be the total taxable value of land and additions on the property. | Land | Improvement |
|---|---|---|---|---|
| 2025 | $1,571 | $420,075 | $130,015 | $290,060 |
| 2024 | $1,549 | $227,149 | $71,508 | $155,641 |
| 2023 | $1,574 | $225,500 | $68,739 | $156,761 |
| 2022 | $2,036 | $237,050 | $60,501 | $176,549 |
| 2021 | $1,543 | $321,000 | $79,963 | $241,037 |
| 2020 | $1,420 | $285,000 | $79,963 | $205,037 |
| 2019 | $1,649 | $257,000 | $49,906 | $207,094 |
| 2018 | $1,497 | $224,000 | $42,041 | $181,959 |
| 2017 | $1,349 | $194,000 | $42,041 | $151,959 |
| 2016 | $1,307 | $102,166 | $21,944 | $80,222 |
| 2015 | $1,146 | $93,196 | $21,944 | $71,252 |
| 2014 | $1,155 | $92,781 | $19,237 | $73,544 |
Source: Public Records
Map
Nearby Homes
- 4813 S 3850 W
- 4950 3900 West St
- 4024 W 4650 S
- 4602 S 4000 W
- 4101 W 4600 S
- 4088 W 5050 S
- 4853 S 4275 W Unit 27
- 4218 W 5050 S
- 4096 W 5075 S
- 3517 W 4835 S Unit 27
- 3509 W 4835 S Unit 26
- 4486 S 4300 W
- 5035 S 4275 W
- 4216 W 5250 S
- 3808 W 4300 S
- 3610 W 4475 S
- 4277 W 5250 S
- 3405 W 4525 S
- 4239 W 5325 S
- 5412 S 3925 W
Your Personal Tour Guide
Ask me questions while you tour the home.