4730 S Redbud Dr Sand Springs, OK 74063
Prattville NeighborhoodEstimated Value: $232,693 - $246,000
3
Beds
2
Baths
1,560
Sq Ft
$153/Sq Ft
Est. Value
About This Home
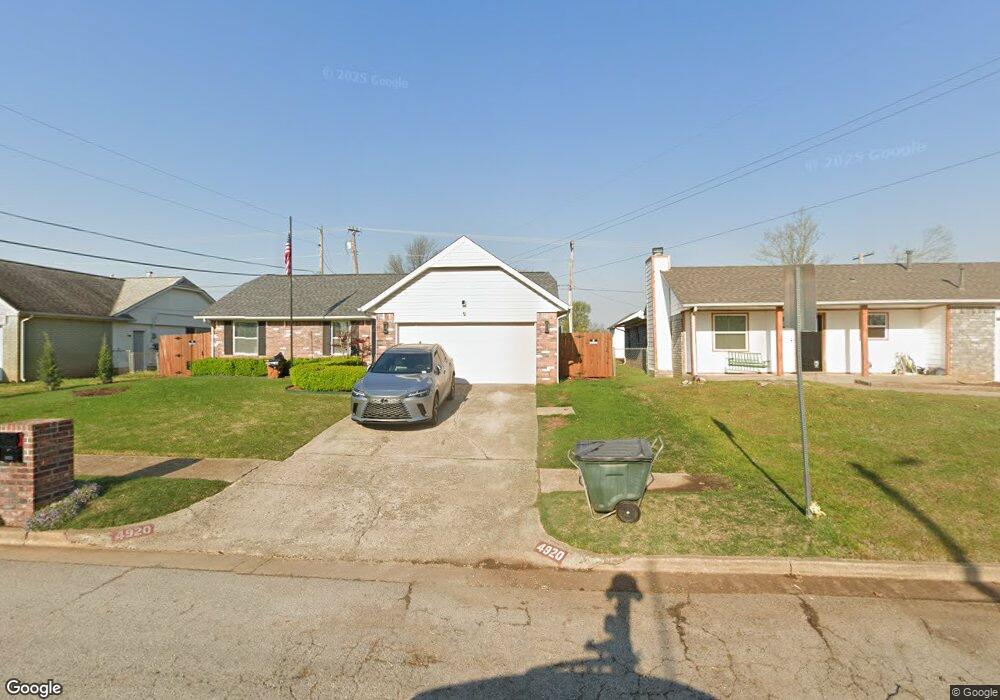
This home is located at 4730 S Redbud Dr, Sand Springs, OK 74063 and is currently estimated at $238,423, approximately $152 per square foot. 4730 S Redbud Dr is a home located in Tulsa County with nearby schools including Angus Valley Elementary School, Clyde Boyd Middle School, and Charles Page High School.
Ownership History
Date
Name
Owned For
Owner Type
Purchase Details
Closed on
Sep 28, 2021
Sold by
Swanson Sarah E
Bought by
Kruse Tyler
Current Estimated Value
Home Financials for this Owner
Home Financials are based on the most recent Mortgage that was taken out on this home.
Original Mortgage
$157,410
Outstanding Balance
$142,605
Interest Rate
2.8%
Mortgage Type
New Conventional
Estimated Equity
$95,818
Purchase Details
Closed on
Sep 17, 2003
Sold by
Harrell Shandee J and Harrell Wade
Bought by
Swanson Charles E and Swanson Sarah E
Purchase Details
Closed on
Jun 11, 1997
Sold by
Shepard Brian Barrett and Sheppard Ronda Sue
Bought by
Smith Shandee J
Home Financials for this Owner
Home Financials are based on the most recent Mortgage that was taken out on this home.
Original Mortgage
$82,200
Interest Rate
7.98%
Mortgage Type
FHA
Purchase Details
Closed on
Jun 1, 1997
Home Financials for this Owner
Home Financials are based on the most recent Mortgage that was taken out on this home.
Original Mortgage
$82,200
Interest Rate
7.98%
Mortgage Type
FHA
Purchase Details
Closed on
Jun 1, 1996
Create a Home Valuation Report for This Property
The Home Valuation Report is an in-depth analysis detailing your home's value as well as a comparison with similar homes in the area
Home Values in the Area
Average Home Value in this Area
Purchase History
| Date | Buyer | Sale Price | Title Company |
|---|---|---|---|
| Kruse Tyler | $175,000 | Colonial Title Inc | |
| Swanson Charles E | $112,000 | -- | |
| Smith Shandee J | $83,000 | Guaranty Abstract Company | |
| -- | $83,000 | -- | |
| -- | $84,000 | -- |
Source: Public Records
Mortgage History
| Date | Status | Borrower | Loan Amount |
|---|---|---|---|
| Open | Kruse Tyler | $157,410 | |
| Previous Owner | Smith Shandee J | $82,200 |
Source: Public Records
Tax History Compared to Growth
Tax History
| Year | Tax Paid | Tax Assessment Tax Assessment Total Assessment is a certain percentage of the fair market value that is determined by local assessors to be the total taxable value of land and additions on the property. | Land | Improvement |
|---|---|---|---|---|
| 2025 | $2,405 | $18,828 | $1,860 | $16,968 |
| 2024 | $2,303 | $18,250 | $2,294 | $15,956 |
| 2023 | $2,303 | $19,250 | $2,420 | $16,830 |
| 2022 | $2,251 | $18,250 | $2,294 | $15,956 |
| 2021 | $1,420 | $11,320 | $1,891 | $9,429 |
| 2020 | $1,470 | $11,320 | $1,891 | $9,429 |
| 2019 | $1,429 | $11,320 | $1,891 | $9,429 |
| 2018 | $1,392 | $11,320 | $1,891 | $9,429 |
| 2017 | $1,364 | $12,320 | $2,525 | $9,795 |
| 2016 | $1,392 | $12,320 | $2,525 | $9,795 |
| 2015 | $1,412 | $12,452 | $2,552 | $9,900 |
| 2014 | $1,425 | $12,452 | $2,552 | $9,900 |
Source: Public Records
Map
Nearby Homes
- 409 Trinidad Dr
- 321 W 50th Place
- 5101 S Spruce Dr
- 5111 Skylane Place
- 5109 S Nassau Ave
- 5113 S Walnut Creek Dr
- 5114 S Everett Dr
- 605 W Angus Dr
- 5110 S Everett Dr
- Ridgway III Plan at Stone Creek Estates IV
- Brenda MG Plan at Stone Creek Estates IV
- Walker ll Plan at Stone Creek Estates IV
- Dorsey Farm House Plan at Stone Creek Estates IV
- Oak Plan at Stone Creek Estates IV
- Ashville AE Plan at Stone Creek Estates IV
- Ashville Plan at Stone Creek Estates IV
- Lee II Plan at Stone Creek Estates IV
- Brenda Plan at Stone Creek Estates IV
- Hampton III Plan at Stone Creek Estates IV
- Hampton IV 3C Plan at Stone Creek Estates IV
- 4920 S Redbud Dr
- 4914 S Redbud Dr
- 4912 S Redbud Dr
- 4908 S Redbud Dr
- 4906 S Redbud Dr
- 4920 Redbud Dr
- 4734 S Redbud Dr
- 4714 S Redbud Dr
- 4530 S Redbud Dr
- 4710 S Redbud Dr
- 4718 S Redbud Dr
- 4510 S Redbud Dr
- 4726 S Redbud Dr
- 4518 S Redbud Dr
- 4502 S Redbud Dr
- 4702 S Redbud Dr
- 4628 S Redbud Dr
- 4706 S Redbud Dr
- 4918 Redbud Dr
- 4922 Redbud Dr