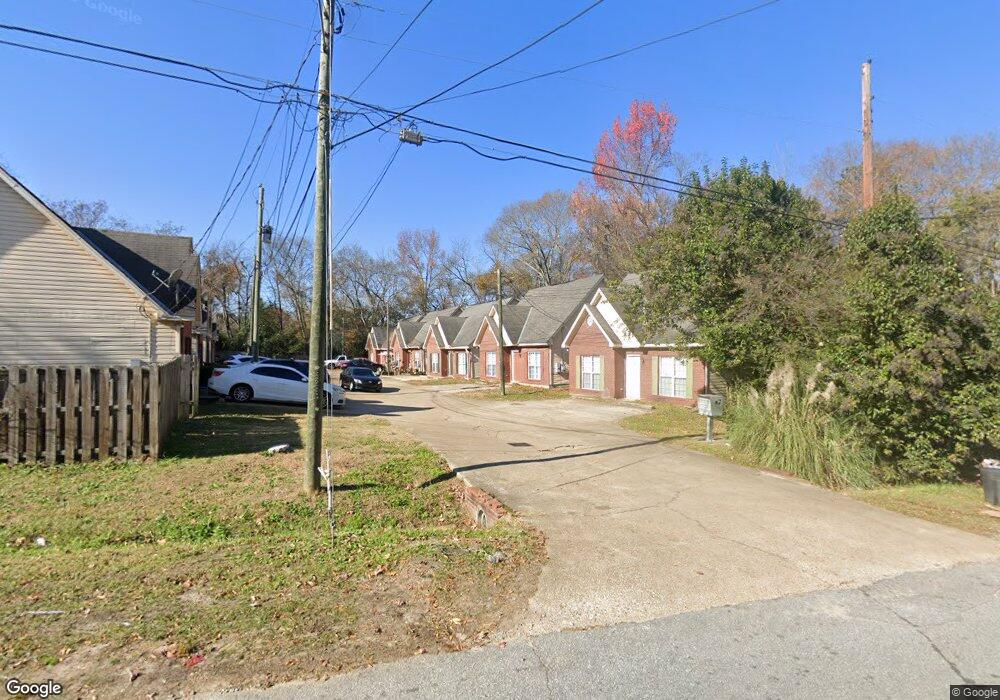
4731 11th Ave Unit 5 Columbus, GA 31904
Columbus Tech-Bealwood NeighborhoodEstimated Value: $89,000 - $191,000
4
Beds
2
Baths
1,372
Sq Ft
$102/Sq Ft
Est. Value
About This Home
This home is located at 4731 11th Ave Unit 5, Columbus, GA 31904 and is currently estimated at $139,291, approximately $101 per square foot. 4731 11th Ave Unit 5 is a home located in Muscogee County with nearby schools including River Road Elementary School, Arnold Middle School, and Jordan Vocational High School.
Ownership History
Date
Name
Owned For
Owner Type
Purchase Details
Closed on
Apr 13, 2009
Sold by
Price William D
Bought by
Ric Mark Properties Llc
Current Estimated Value
Home Financials for this Owner
Home Financials are based on the most recent Mortgage that was taken out on this home.
Original Mortgage
$40,000
Interest Rate
4.8%
Mortgage Type
Purchase Money Mortgage
Purchase Details
Closed on
Apr 10, 2009
Sold by
Bank Of America National Association
Bought by
Price William D
Home Financials for this Owner
Home Financials are based on the most recent Mortgage that was taken out on this home.
Original Mortgage
$40,000
Interest Rate
4.8%
Mortgage Type
Purchase Money Mortgage
Purchase Details
Closed on
Jan 6, 2009
Sold by
Peak Fred D
Bought by
Bank Of America National Association
Create a Home Valuation Report for This Property
The Home Valuation Report is an in-depth analysis detailing your home's value as well as a comparison with similar homes in the area
Home Values in the Area
Average Home Value in this Area
Purchase History
| Date | Buyer | Sale Price | Title Company |
|---|---|---|---|
| Ric Mark Properties Llc | $36,000 | None Available | |
| Price William D | $30,000 | None Available | |
| Bank Of America National Association | $52,881 | None Available |
Source: Public Records
Mortgage History
| Date | Status | Borrower | Loan Amount |
|---|---|---|---|
| Previous Owner | Ric Mark Properties Llc | $40,000 |
Source: Public Records
Tax History Compared to Growth
Tax History
| Year | Tax Paid | Tax Assessment Tax Assessment Total Assessment is a certain percentage of the fair market value that is determined by local assessors to be the total taxable value of land and additions on the property. | Land | Improvement |
|---|---|---|---|---|
| 2025 | $797 | $20,352 | $3,328 | $17,024 |
| 2024 | $797 | $20,352 | $3,328 | $17,024 |
| 2023 | $802 | $20,352 | $3,328 | $17,024 |
| 2022 | $700 | $17,149 | $3,328 | $13,821 |
| 2021 | $627 | $15,350 | $3,328 | $12,022 |
| 2020 | $627 | $15,350 | $3,328 | $12,022 |
| 2019 | $629 | $15,350 | $3,328 | $12,022 |
| 2018 | $629 | $15,350 | $3,328 | $12,022 |
| 2017 | $631 | $15,350 | $3,328 | $12,022 |
| 2016 | $675 | $16,373 | $3,341 | $13,032 |
| 2015 | $676 | $16,373 | $3,341 | $13,032 |
| 2014 | $677 | $16,373 | $3,341 | $13,032 |
| 2013 | -- | $16,373 | $3,341 | $13,032 |
Source: Public Records
Map
Nearby Homes
- 4731 11th Ave Unit 10
- 4731 11th Ave Unit 9
- 4731 11th Ave Unit 8
- 4731 11th Ave Unit 7
- 4731 11th Ave Unit 6
- 4731 11th Ave Unit 4
- 4731 11th Ave Unit 3
- 4731 11th Ave Unit 2
- 4731 11th Ave Unit 1
- 4731 11th Ave
- 4743 11th Ave
- 4725 11th Ave
- 4747 11th Ave
- 4723 11th Ave
- 4751 11th Ave
- 4721 11th Ave
- 4744 Kolb Ave
- 4748 Kolb Ave
- 4740 Kolb Ave
- 4752 Kolb Ave