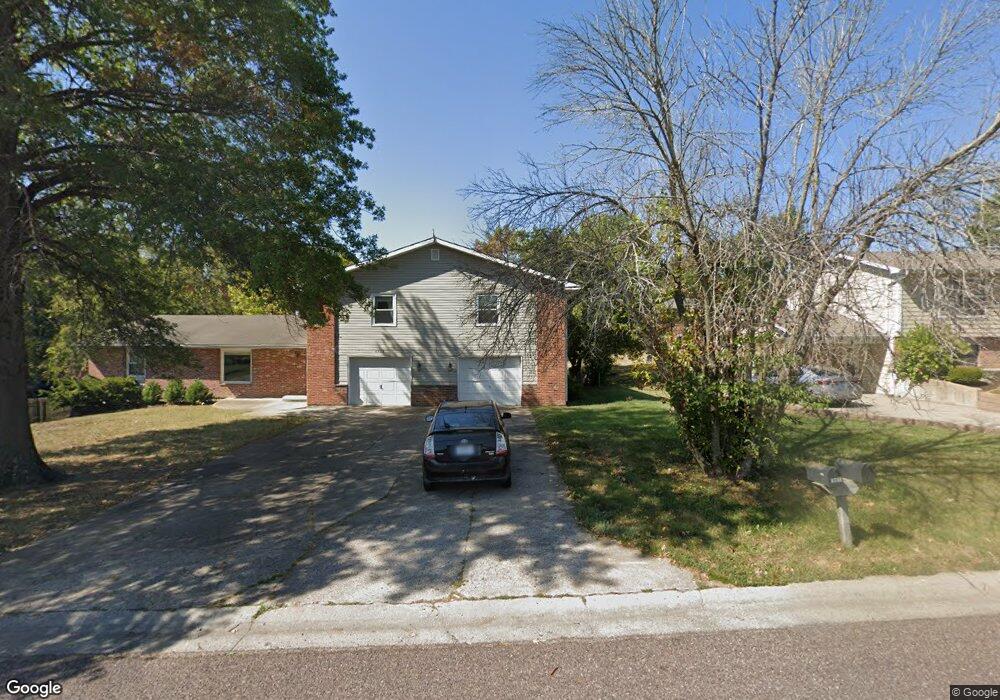
4731 Apple Tree Ln Unit 4733 Columbia, MO 65203
Cedar Lake NeighborhoodEstimated Value: $312,000 - $422,845
3
Beds
2
Baths
4,078
Sq Ft
$93/Sq Ft
Est. Value
About This Home
This home is located at 4731 Apple Tree Ln Unit 4733, Columbia, MO 65203 and is currently estimated at $378,711, approximately $92 per square foot. 4731 Apple Tree Ln Unit 4733 is a home located in Boone County with nearby schools including Mill Creek Elementary School, Ann Hawkins Gentry Middle School, and Rock Bridge High School.
Ownership History
Date
Name
Owned For
Owner Type
Purchase Details
Closed on
Jun 18, 2025
Sold by
Evans Mark J and Evans Monica S
Bought by
Marmon Properties Llc
Current Estimated Value
Purchase Details
Closed on
Oct 1, 2013
Sold by
Schuenemeyer Thomas and Schuenemeyer Nancy
Bought by
Evans Mark J and Evans Monica S
Home Financials for this Owner
Home Financials are based on the most recent Mortgage that was taken out on this home.
Original Mortgage
$146,000
Interest Rate
4.46%
Mortgage Type
New Conventional
Purchase Details
Closed on
Aug 29, 2006
Sold by
Althage Karl F and Althage Karen S
Bought by
Schuenemeyer Thomas and Schuenemeyer Nancy
Home Financials for this Owner
Home Financials are based on the most recent Mortgage that was taken out on this home.
Original Mortgage
$130,500
Interest Rate
6.79%
Mortgage Type
New Conventional
Create a Home Valuation Report for This Property
The Home Valuation Report is an in-depth analysis detailing your home's value as well as a comparison with similar homes in the area
Home Values in the Area
Average Home Value in this Area
Purchase History
| Date | Buyer | Sale Price | Title Company |
|---|---|---|---|
| Marmon Properties Llc | -- | None Listed On Document | |
| Evans Mark J | -- | Boone Central Title Company | |
| Schuenemeyer Thomas | -- | Boone Central Title Company |
Source: Public Records
Mortgage History
| Date | Status | Borrower | Loan Amount |
|---|---|---|---|
| Previous Owner | Evans Mark J | $146,000 | |
| Previous Owner | Schuenemeyer Thomas | $130,500 |
Source: Public Records
Tax History
| Year | Tax Paid | Tax Assessment Tax Assessment Total Assessment is a certain percentage of the fair market value that is determined by local assessors to be the total taxable value of land and additions on the property. | Land | Improvement |
|---|---|---|---|---|
| 2025 | $2,245 | $34,276 | $4,237 | $30,039 |
| 2024 | $2,102 | $31,160 | $4,237 | $26,923 |
| 2023 | $2,085 | $31,160 | $4,237 | $26,923 |
| 2022 | $2,003 | $29,963 | $4,237 | $25,726 |
| 2021 | $2,006 | $29,963 | $4,237 | $25,726 |
| 2020 | $1,977 | $27,743 | $4,237 | $23,506 |
| 2019 | $1,977 | $27,743 | $4,237 | $23,506 |
| 2018 | $1,843 | $0 | $0 | $0 |
| 2017 | $1,821 | $25,688 | $4,237 | $21,451 |
| 2016 | $1,818 | $25,688 | $4,237 | $21,451 |
| 2015 | $1,670 | $25,688 | $4,237 | $21,451 |
| 2014 | -- | $25,688 | $4,237 | $21,451 |
Source: Public Records
Map
Nearby Homes
- 701 N Cedar Lake Dr W
- 902 Shakertown Way
- LOT 129 Clear Creek Estates
- 904 Shakertown Way
- LOT 136 Clear Creek Estates
- LOT 128 Clear Creek Estates
- LOT 101 Clear Creek Estates
- 4705 Brandon Woods St
- 1101 W Southampton Dr
- 5008 Cedar Ridge Dr
- 1201 S Bridgewood Dr
- 504 Dustin Dr
- 4103 Nashua Ct
- 4909 Royal Lytham Dr
- 4504 Royal Lytham Dr
- 301 E Old Plank Rd
- 4506 Kirkdale Ct
- 3808 Barrington Dr
- 809 Rutland Dr
- 1609 Kenilworth Dr
- 4731-4733 Apple Tree Ln
- 4733 Apple Tree Ln
- 4705 Apple Tree Ln Unit 4707
- 542 Pear Tree Cir Unit 544
- 4757 Apple Tree Ln Unit 4759
- 532 Pear Tree Cir Unit 534
- 552 Pear Tree Cir Unit 554
- 481 Maple Grove Way Unit 483
- 481-483 Maple Grove Way
- 4657 Apple Tree Ln Unit 4659
- 482 Maple Grove Way Unit 484
- 501 N Cedar Lake Dr W
- 527 N Cedar Lake Dr W
- 522 Pear Tree Cir Unit 524
- 457 Maple Grove Way
- 457 Maple Grove Way
- 545 Pear Tree Cir
- 543 Pear Tree Cir Unit 545
- 456 Maple Grove Way Unit 458
- 455 Maple Grove Way Unit 457