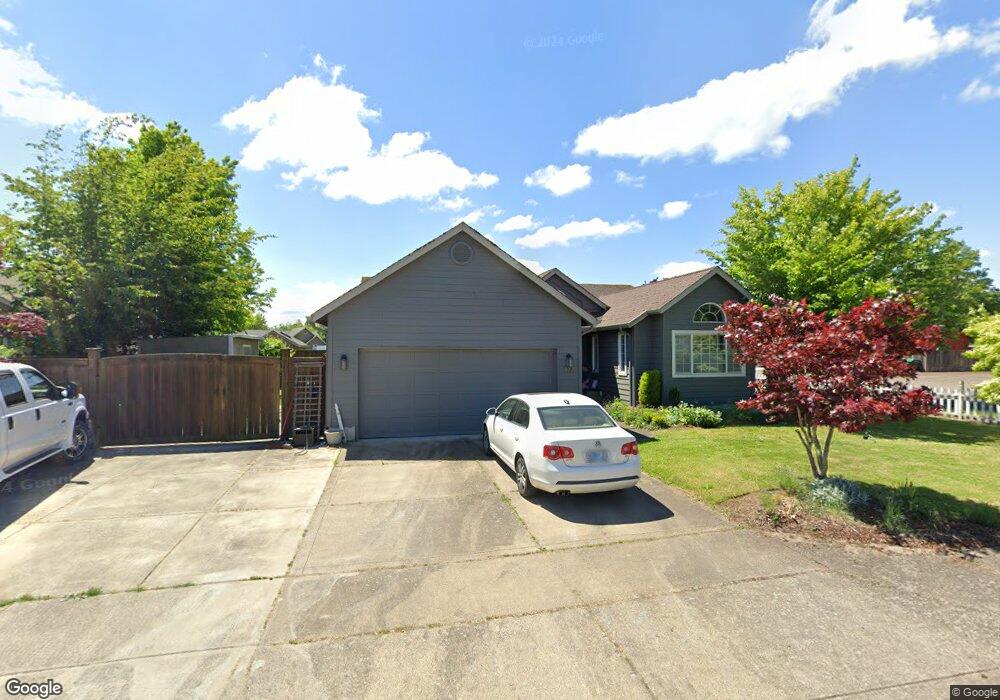
4731 Calumet Way Eugene, OR 97404
Santa Clara NeighborhoodEstimated Value: $452,000 - $494,000
3
Beds
2
Baths
1,516
Sq Ft
$313/Sq Ft
Est. Value
About This Home
This home is located at 4731 Calumet Way, Eugene, OR 97404 and is currently estimated at $474,785, approximately $313 per square foot. 4731 Calumet Way is a home located in Lane County with nearby schools including Awbrey Park Elementary School, Madison Middle School, and North Eugene High School.
Ownership History
Date
Name
Owned For
Owner Type
Purchase Details
Closed on
Sep 12, 2012
Sold by
Jorgensen Joyce M
Bought by
Peck Oliver J and Peck Jessica M
Current Estimated Value
Home Financials for this Owner
Home Financials are based on the most recent Mortgage that was taken out on this home.
Original Mortgage
$207,668
Outstanding Balance
$147,789
Interest Rate
3.5%
Mortgage Type
FHA
Estimated Equity
$324,868
Purchase Details
Closed on
Mar 19, 2001
Sold by
Jorgensen James E
Bought by
Jorgensen Nels R and Jorgensen Joyce M
Purchase Details
Closed on
Jun 14, 1999
Sold by
Merryman Kathleen D
Bought by
Jorgensen James E
Home Financials for this Owner
Home Financials are based on the most recent Mortgage that was taken out on this home.
Original Mortgage
$150,350
Interest Rate
7.01%
Purchase Details
Closed on
Oct 8, 1998
Sold by
Jones Michael D and Jones Susan A
Bought by
Merryman Kathleen D
Home Financials for this Owner
Home Financials are based on the most recent Mortgage that was taken out on this home.
Original Mortgage
$96,850
Interest Rate
9.5%
Create a Home Valuation Report for This Property
The Home Valuation Report is an in-depth analysis detailing your home's value as well as a comparison with similar homes in the area
Home Values in the Area
Average Home Value in this Area
Purchase History
| Date | Buyer | Sale Price | Title Company |
|---|---|---|---|
| Peck Oliver J | $211,500 | Western Title & Escrow Compa | |
| Jorgensen Nels R | $160,000 | Western Pioneer Title Co | |
| Jorgensen James E | $155,000 | Title Guaranty Company | |
| Merryman Kathleen D | $149,000 | Western Pioneer Title Co |
Source: Public Records
Mortgage History
| Date | Status | Borrower | Loan Amount |
|---|---|---|---|
| Open | Peck Oliver J | $32,000 | |
| Open | Peck Oliver J | $207,668 | |
| Previous Owner | Jorgensen James E | $150,350 | |
| Previous Owner | Merryman Kathleen D | $96,850 |
Source: Public Records
Tax History Compared to Growth
Tax History
| Year | Tax Paid | Tax Assessment Tax Assessment Total Assessment is a certain percentage of the fair market value that is determined by local assessors to be the total taxable value of land and additions on the property. | Land | Improvement |
|---|---|---|---|---|
| 2023 | $4,671 | $228,802 | $0 | $0 |
| 2022 | $4,376 | $222,138 | $0 | $0 |
| 2021 | $4,110 | $215,668 | $0 | $0 |
| 2020 | $4,124 | $209,387 | $0 | $0 |
| 2019 | $3,983 | $203,289 | $0 | $0 |
| 2018 | $3,749 | $191,619 | $0 | $0 |
| 2017 | $3,568 | $191,619 | $0 | $0 |
| 2016 | $3,435 | $186,038 | $0 | $0 |
| 2015 | $3,303 | $180,619 | $0 | $0 |
| 2014 | $3,235 | $175,358 | $0 | $0 |
Source: Public Records
Map
Nearby Homes
- 4775 Scenic Dr
- 4462 Calumet Way
- 4733 Spring Meadow Ave
- 0 E Beacon Dr Unit 645105801
- 4471 Spring Meadow Ave
- 4779 Sedona Dr
- 415 Spring Creek Dr
- 4385 Berry Ln
- 4376 Katy Ln
- 4095 Kildare St
- 4675 Symphony Dr
- 195 Daniel Dr
- 331 Limerick Ave
- 397 River Loop 2
- 3843 Shannon St
- 4060 Hampshire Ln
- 522 River Loop 2
- 3835 River Rd
- 4463 Altura St
- 4084 Hampshire Ln
- 4745 Calumet Way
- 4683 Calumet Way
- 4728 Calumet Way
- 4779 Calumet Way
- 4753 Calumet Way
- 4716 Calumet Way
- 4754 Calumet Way
- 4686 Calumet Way
- 4784 Calumet Way
- 4827 Calumet Way
- 4663 Calumet Way
- 4833 Calumet Way
- 4731 Briars St
- 4747 Briars St
- 4664 Calumet Way
- 4730 Herman St
- 4750 Herman St
- 4814 Calumet Way
- 4715 Briars St