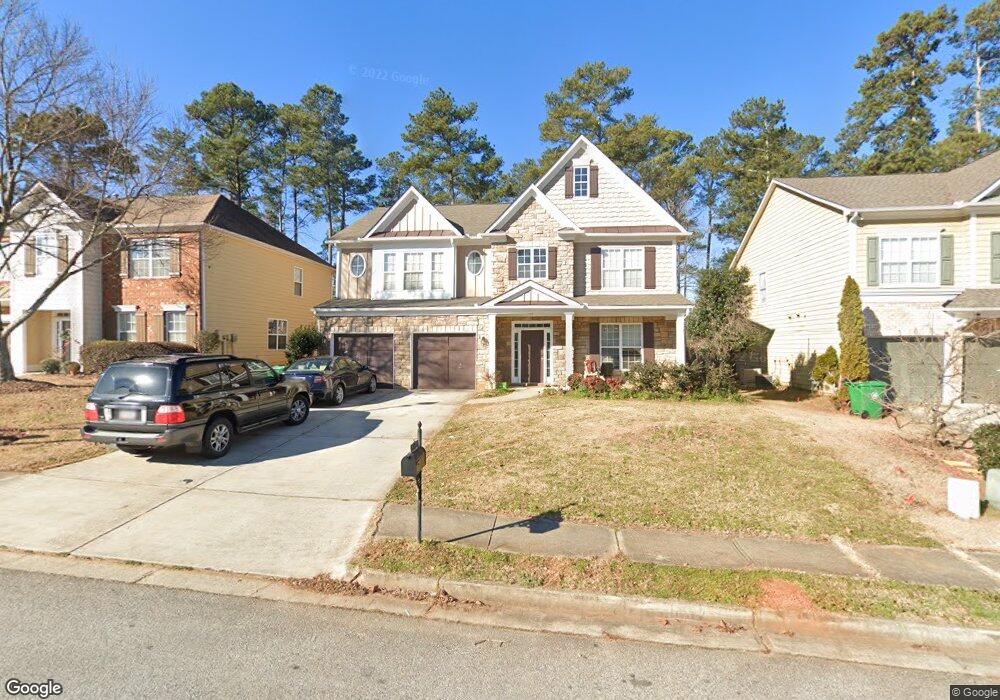
4731 Hearthstone Trace Stone Mountain, GA 30083
Estimated Value: $385,000 - $441,000
4
Beds
3
Baths
3,562
Sq Ft
$116/Sq Ft
Est. Value
About This Home
This home is located at 4731 Hearthstone Trace, Stone Mountain, GA 30083 and is currently estimated at $412,603, approximately $115 per square foot. 4731 Hearthstone Trace is a home located in DeKalb County with nearby schools including Hambrick Elementary School, Stone Mountain Middle School, and Stone Mountain High School.
Ownership History
Date
Name
Owned For
Owner Type
Purchase Details
Closed on
Jul 30, 2024
Sold by
Nguyen Hung T
Bought by
Nguyen Phuong Ha and Dang Dung Thi
Current Estimated Value
Purchase Details
Closed on
Mar 4, 2009
Sold by
National Cty Bk
Bought by
Nguyen Hung T
Home Financials for this Owner
Home Financials are based on the most recent Mortgage that was taken out on this home.
Original Mortgage
$130,000
Interest Rate
5.1%
Mortgage Type
New Conventional
Purchase Details
Closed on
Nov 4, 2008
Sold by
Allen Erid D
Bought by
National Cty Mtg
Purchase Details
Closed on
Feb 3, 2006
Sold by
Davis Misty H
Bought by
Allen Eric D
Home Financials for this Owner
Home Financials are based on the most recent Mortgage that was taken out on this home.
Original Mortgage
$184,000
Interest Rate
6.14%
Mortgage Type
New Conventional
Purchase Details
Closed on
Jun 30, 2003
Sold by
D R Horton Inc
Bought by
Davis Misty H
Home Financials for this Owner
Home Financials are based on the most recent Mortgage that was taken out on this home.
Original Mortgage
$202,965
Interest Rate
5.2%
Mortgage Type
New Conventional
Create a Home Valuation Report for This Property
The Home Valuation Report is an in-depth analysis detailing your home's value as well as a comparison with similar homes in the area
Home Values in the Area
Average Home Value in this Area
Purchase History
| Date | Buyer | Sale Price | Title Company |
|---|---|---|---|
| Nguyen Phuong Ha | $343,000 | -- | |
| Nguyen Hung T | $162,500 | -- | |
| National Cty Mtg | -- | -- | |
| Allen Eric D | $230,000 | -- | |
| Davis Misty H | $203,000 | -- |
Source: Public Records
Mortgage History
| Date | Status | Borrower | Loan Amount |
|---|---|---|---|
| Previous Owner | Nguyen Hung T | $130,000 | |
| Previous Owner | Allen Eric D | $184,000 | |
| Previous Owner | Davis Misty H | $202,965 |
Source: Public Records
Tax History Compared to Growth
Tax History
| Year | Tax Paid | Tax Assessment Tax Assessment Total Assessment is a certain percentage of the fair market value that is determined by local assessors to be the total taxable value of land and additions on the property. | Land | Improvement |
|---|---|---|---|---|
| 2025 | $4,686 | $163,760 | $32,400 | $131,360 |
| 2024 | $5,017 | $172,040 | $32,400 | $139,640 |
| 2023 | $5,017 | $174,640 | $32,400 | $142,240 |
| 2022 | $4,491 | $150,640 | $18,000 | $132,640 |
| 2021 | $3,296 | $98,880 | $18,000 | $80,880 |
| 2020 | $3,205 | $94,680 | $5,920 | $88,760 |
| 2019 | $3,188 | $95,520 | $5,920 | $89,600 |
| 2018 | $2,637 | $96,720 | $5,920 | $90,800 |
| 2017 | $3,069 | $88,160 | $5,920 | $82,240 |
| 2016 | $2,503 | $74,000 | $5,920 | $68,080 |
| 2014 | $2,107 | $62,920 | $5,920 | $57,000 |
Source: Public Records
Map
Nearby Homes
- 934 Fireside Way
- 4468 Anderson Rd
- 862 Fireside Way Unit 1
- 4467 Boatmans Cove
- 4424 Central Dr
- 798 Windchase Ln
- 695 Windchase Ln
- 1001 Park Gate Place Unit 2B
- 4362 Timberlake Unit 4362
- 1086 Old Saybrook Ct
- 4358 Timberlake
- 1097 Old Saybrook Ct
- 4351 Timberlake
- 4247 Bingham Ct
- 1075 Forest Heights Rd
- 4362 Thunder Fork Dr
- 1042 Cedar Forest Ct
- 4642 Orchid Dr
- 4723 Hearthstone Trace
- 4739 Hearthstone Trace
- 4715 Hearthstone Trace
- 4747 Hearthstone Trace
- 4707 Hearthstone Trace
- 4482 Abingdon Dr Unit 1
- 4732 Hearthstone Trace
- 4755 Hearthstone Trace
- 4740 Hearthstone Trace
- 4724 Hearthstone Trace
- 4748 Hearthstone Trace
- 0 Hearthstone Trace Unit 9027299
- 0 Hearthstone Trace Unit 3248618
- 0 Hearthstone Trace Unit 7071442
- 0 Hearthstone Trace Unit 7083632
- 0 Hearthstone Trace Unit 7087872
- 0 Hearthstone Trace Unit 7529719
- 0 Hearthstone Trace Unit 8381250
- 4716 Hearthstone Trace
- 4701 Hearthstone Trace