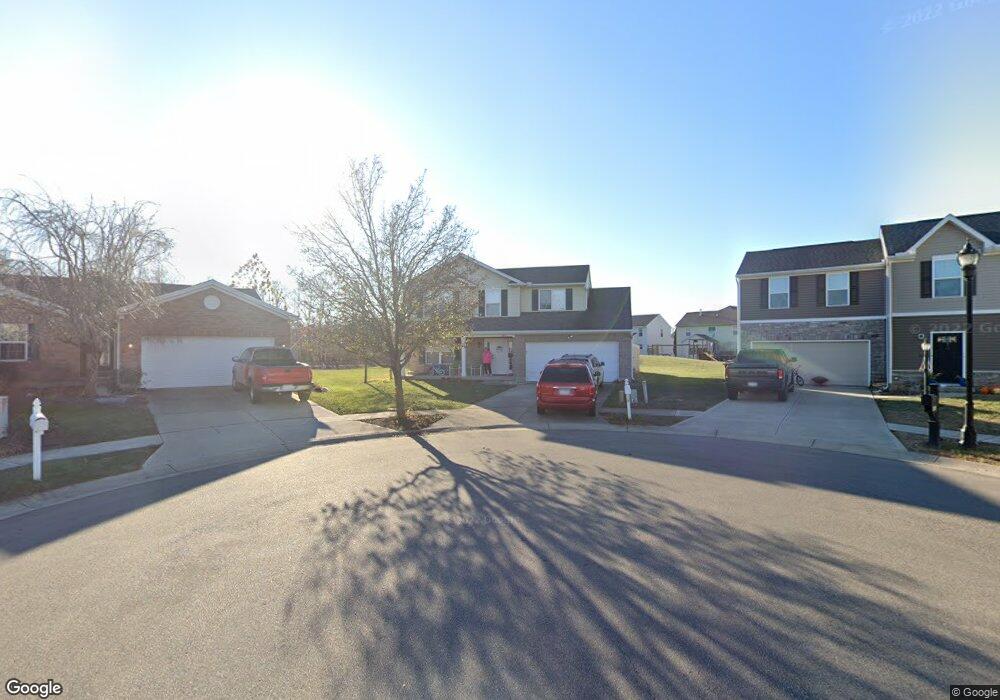
4731 Jacob Andrew Ct Morrow, OH 45152
Estimated Value: $340,412 - $359,000
4
Beds
3
Baths
1,825
Sq Ft
$192/Sq Ft
Est. Value
About This Home
This home is located at 4731 Jacob Andrew Ct, Morrow, OH 45152 and is currently estimated at $350,103, approximately $191 per square foot. 4731 Jacob Andrew Ct is a home located in Warren County with nearby schools including Little Miami Early Childhood Center, Little Miami Intermediate Middle School, and Little Miami Middle School.
Ownership History
Date
Name
Owned For
Owner Type
Purchase Details
Closed on
Sep 24, 2024
Sold by
Warren County
Bought by
V-Rahas Investments Llc
Current Estimated Value
Purchase Details
Closed on
May 24, 2018
Sold by
Cole Allen Garrett and Allen Caylin Marie
Bought by
Hall Samantha and Hall Matthew
Home Financials for this Owner
Home Financials are based on the most recent Mortgage that was taken out on this home.
Original Mortgage
$174,747
Interest Rate
4.5%
Mortgage Type
New Conventional
Purchase Details
Closed on
Aug 24, 2015
Sold by
Capps Drew M and Capps Holly
Bought by
Cole Allen Garrett and Hester Caylin Marie
Purchase Details
Closed on
Mar 20, 2008
Sold by
Charleston Signature Homes Llc
Bought by
Capps Drew M and Capps Holly
Home Financials for this Owner
Home Financials are based on the most recent Mortgage that was taken out on this home.
Original Mortgage
$154,900
Interest Rate
6.32%
Mortgage Type
Unknown
Purchase Details
Closed on
Apr 20, 2007
Sold by
Land Liquidators Llc
Bought by
Charleston Signature Homes Llc
Purchase Details
Closed on
Feb 24, 2006
Sold by
Nathaniel Development Co Inc
Bought by
Holiday Builders Of Ohio Llc and Hb Home Builders
Create a Home Valuation Report for This Property
The Home Valuation Report is an in-depth analysis detailing your home's value as well as a comparison with similar homes in the area
Home Values in the Area
Average Home Value in this Area
Purchase History
| Date | Buyer | Sale Price | Title Company |
|---|---|---|---|
| V-Rahas Investments Llc | $280,900 | None Listed On Document | |
| Hall Samantha | $173,000 | Vantage Land Title | |
| Cole Allen Garrett | -- | Attorney | |
| Capps Drew M | $154,900 | First Title | |
| Charleston Signature Homes Llc | -- | Attorney | |
| Holiday Builders Of Ohio Llc | $78,000 | First Title |
Source: Public Records
Mortgage History
| Date | Status | Borrower | Loan Amount |
|---|---|---|---|
| Previous Owner | Hall Samantha | $174,747 | |
| Previous Owner | Capps Drew M | $154,900 |
Source: Public Records
Tax History
| Year | Tax Paid | Tax Assessment Tax Assessment Total Assessment is a certain percentage of the fair market value that is determined by local assessors to be the total taxable value of land and additions on the property. | Land | Improvement |
|---|---|---|---|---|
| 2025 | $2,278 | $89,940 | $24,500 | $65,440 |
| 2024 | $2,278 | $89,940 | $24,500 | $65,440 |
| 2023 | $3,537 | $70,063 | $14,455 | $55,608 |
| 2022 | $3,501 | $70,063 | $14,455 | $55,608 |
| 2021 | $3,346 | $70,063 | $14,455 | $55,608 |
| 2020 | $3,332 | $59,374 | $12,250 | $47,124 |
| 2019 | $3,390 | $59,374 | $12,250 | $47,124 |
| 2018 | $3,446 | $59,374 | $12,250 | $47,124 |
| 2017 | $2,884 | $48,720 | $10,210 | $38,511 |
| 2016 | $2,943 | $48,720 | $10,210 | $38,511 |
| 2015 | $2,757 | $48,720 | $10,210 | $38,511 |
| 2014 | $2,876 | $45,530 | $9,540 | $35,990 |
| 2013 | $2,828 | $58,450 | $12,250 | $46,200 |
Source: Public Records
Map
Nearby Homes
- 5021 Sullivan's Ridge Dr
- 3155 Rosemary Ct Unit Lot 94
- 3155 Rosemary Ct
- 4836 Jessica Suzanne Dr
- 4910 Allens Ridge Dr
- 5815 Josie’s Cove
- 4698 Jessica Suzanne Dr
- 6496 Cooper Grace Ln
- 6491 Cooper Grace Ln
- 5670 Julia Kate Dr
- 4997 Jessica Suzanne Dr
- 5023 Mary Louise Ct
- 5056 Mary Louise Ct
- 362 2nd St
- 5168 Allens Ridge Dr
- 5645 Rivers Fork Dr
- 102 Hazen Ave
- 3163 Rosemary Ct
- 3184 Sage Ct
- Lot #1 Middleboro Rd
- 4731 Jacob Andrew Ct
- 4746 Jacob Andrew Ct
- 0 Jacob Andrew Ct Unit 102 1384165
- 0 Jacob Andrew Ct Unit 101
- 101 Jacob Andrew Ct
- 102 Jacob Andrew Ct
- 4745 Jacob Andrew Ct
- 4760 Jacob Andrew Ct
- 4759 Jacob Andrew Ct
- 5868 Anne Marie Dr
- 5882 Anne Marie Dr
- 5062 Sullivans Ridge Dr
- 5070 Sullivans Ridge Dr
- 5854 Anne Marie Dr
- 0 Sullivans Ridge Dr Unit 105 1384171
- 0 Sullivans Ridge Dr Unit 151 1429575
- 0 Sullivans Ridge Dr Unit 141 1429566
- 0 Sullivans Ridge Dr Unit 152 1429577
- 0 Sullivans Ridge Dr Unit 150 1429573
- 0 Sullivans Ridge Dr Unit 156 1429579
Your Personal Tour Guide
Ask me questions while you tour the home.