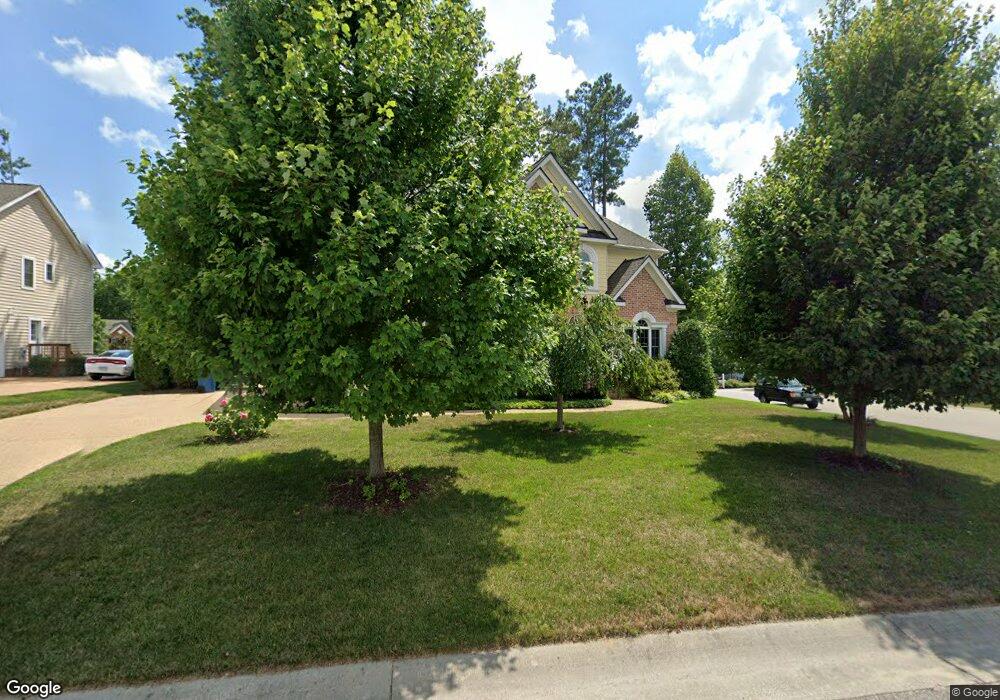
4731 Jennway Loop Moseley, VA 23120
Moseley NeighborhoodEstimated Value: $580,000 - $806,000
3
Beds
3
Baths
2,733
Sq Ft
$251/Sq Ft
Est. Value
About This Home
This home is located at 4731 Jennway Loop, Moseley, VA 23120 and is currently estimated at $685,460, approximately $250 per square foot. 4731 Jennway Loop is a home located in Chesterfield County with nearby schools including Grange Hall Elementary School, Tomahawk Creek Middle School, and Cosby High School.
Ownership History
Date
Name
Owned For
Owner Type
Purchase Details
Closed on
Dec 12, 2011
Sold by
Mirabella Investments Inc
Bought by
Fahy Robert F
Current Estimated Value
Home Financials for this Owner
Home Financials are based on the most recent Mortgage that was taken out on this home.
Original Mortgage
$383,850
Outstanding Balance
$262,579
Interest Rate
4.01%
Mortgage Type
VA
Estimated Equity
$422,881
Purchase Details
Closed on
Jun 6, 2011
Sold by
Base Camp Development Co
Bought by
Mirabella Investments Inc
Create a Home Valuation Report for This Property
The Home Valuation Report is an in-depth analysis detailing your home's value as well as a comparison with similar homes in the area
Home Values in the Area
Average Home Value in this Area
Purchase History
| Date | Buyer | Sale Price | Title Company |
|---|---|---|---|
| Fahy Robert F | $375,800 | -- | |
| Mirabella Investments Inc | $65,000 | -- |
Source: Public Records
Mortgage History
| Date | Status | Borrower | Loan Amount |
|---|---|---|---|
| Open | Fahy Robert F | $383,850 |
Source: Public Records
Tax History
| Year | Tax Paid | Tax Assessment Tax Assessment Total Assessment is a certain percentage of the fair market value that is determined by local assessors to be the total taxable value of land and additions on the property. | Land | Improvement |
|---|---|---|---|---|
| 2025 | $4,909 | $548,800 | $115,000 | $433,800 |
| 2024 | $4,909 | $533,500 | $105,000 | $428,500 |
| 2023 | $4,280 | $470,300 | $100,000 | $370,300 |
| 2022 | $4,005 | $435,300 | $94,000 | $341,300 |
| 2021 | $3,765 | $393,700 | $89,000 | $304,700 |
| 2020 | $3,629 | $382,000 | $87,000 | $295,000 |
| 2019 | $3,610 | $380,000 | $85,000 | $295,000 |
| 2018 | $3,610 | $380,000 | $85,000 | $295,000 |
| 2017 | $3,610 | $376,000 | $85,000 | $291,000 |
| 2016 | $3,554 | $370,200 | $82,000 | $288,200 |
| 2015 | $3,468 | $358,600 | $81,000 | $277,600 |
| 2014 | $3,261 | $337,100 | $80,000 | $257,100 |
Source: Public Records
Map
Nearby Homes
- 4513 Lake Summer Mews
- 16847 Jaydee Terrace
- 16843 Warren Crest Ct
- 16875 Jaydee Ct
- 4806 Singing Bird Dr
- 16801 Jennway Ct
- 16806 Jennway Ct
- 17319 Otter Dr
- 4812 Singing Bird Dr
- 4612 Otter Ct
- 4606 Otter Ct
- 17319 Burtmoor Ct
- 4925 Singing Bird Dr
- 17300 Singing Bird Turn
- 17312 Jojo Ln
- 17306
- 4613 Otter Ct
- 17403 Singing Bird Ct
- 4624 Lake Summer Loop
- 17409 Singing Bird Ct
- 4725 Jennway Loop
- 4801 Jennway Loop
- 4702 Summer Lake Ct
- 4719 Jennway Loop
- 4800 Jennway Loop
- 4730 Jennway Loop
- 4724 Jennway Loop
- 4606 Easter Rd
- 4718 Jennway Loop
- 4807 Jennway Loop
- 4708 Summer Lake Ct
- 4703 Summer Lake Ct
- 4713 Jennway Loop
- 4612 Easter Rd
- 4542 Lake Summer Mews
- 4806 Jennway Loop
- 4806 Jennway Loop Unit 9
- 4712 Jennway Loop
- 4714 Summer Lake Ct
- 17000 Shoreland Dr
Your Personal Tour Guide
Ask me questions while you tour the home.