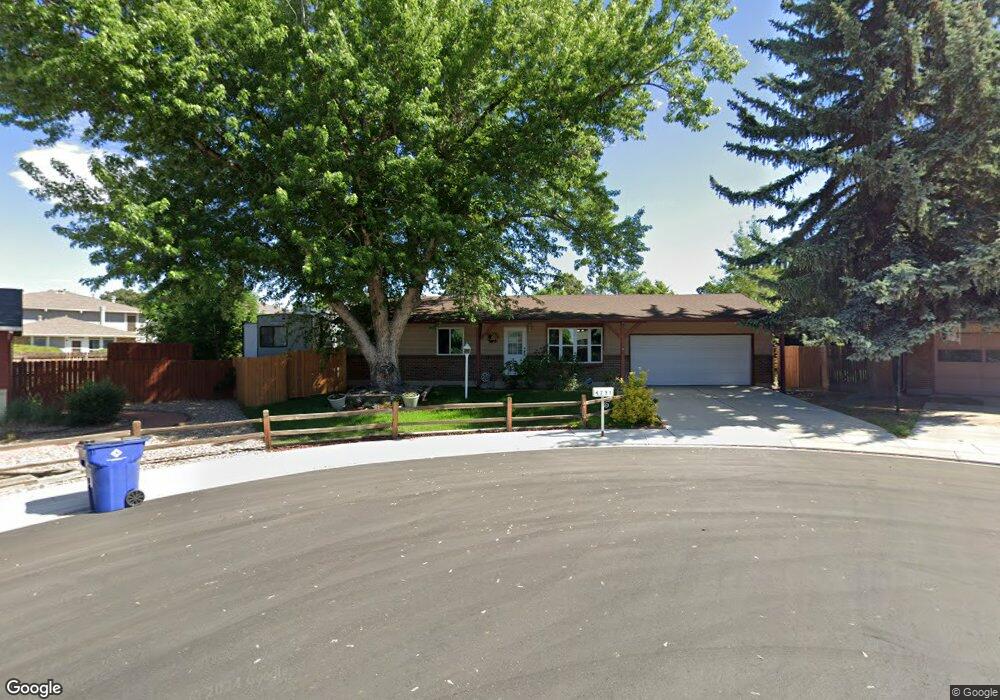
4731 Rincon Place Colorado Springs, CO 80918
Vista Grande NeighborhoodEstimated Value: $385,000 - $452,000
4
Beds
2
Baths
1,312
Sq Ft
$314/Sq Ft
Est. Value
About This Home
This home is located at 4731 Rincon Place, Colorado Springs, CO 80918 and is currently estimated at $412,530, approximately $314 per square foot. 4731 Rincon Place is a home located in El Paso County with nearby schools including Keller Elementary School, Russell Middle School, and Doherty High School.
Ownership History
Date
Name
Owned For
Owner Type
Purchase Details
Closed on
Feb 12, 2021
Sold by
Busse Richard J and Busse Alyson M
Bought by
Busse Family Revocable Trust
Current Estimated Value
Home Financials for this Owner
Home Financials are based on the most recent Mortgage that was taken out on this home.
Original Mortgage
$188,683
Outstanding Balance
$169,333
Interest Rate
2.9%
Mortgage Type
VA
Estimated Equity
$243,197
Purchase Details
Closed on
Jul 7, 2018
Sold by
Busse Richard J and Busse Alyson M
Bought by
Busse Family Revocable Trust
Purchase Details
Closed on
May 12, 2005
Sold by
Hawkins Randy L
Bought by
Busse Richard J and Busse Alyson M
Home Financials for this Owner
Home Financials are based on the most recent Mortgage that was taken out on this home.
Original Mortgage
$143,920
Interest Rate
5.92%
Mortgage Type
Unknown
Purchase Details
Closed on
Oct 3, 1991
Bought by
Busse Richard J
Purchase Details
Closed on
Aug 1, 1981
Bought by
Busse Richard J
Create a Home Valuation Report for This Property
The Home Valuation Report is an in-depth analysis detailing your home's value as well as a comparison with similar homes in the area
Home Values in the Area
Average Home Value in this Area
Purchase History
| Date | Buyer | Sale Price | Title Company |
|---|---|---|---|
| Busse Family Revocable Trust | -- | Amrock Llc | |
| Busse Richard J | -- | Amrock Llc | |
| Busse Family Revocable Trust | -- | None Available | |
| Busse Richard J | $179,900 | Stewart Title | |
| Busse Richard J | $73,800 | -- | |
| Busse Richard J | -- | -- |
Source: Public Records
Mortgage History
| Date | Status | Borrower | Loan Amount |
|---|---|---|---|
| Open | Busse Family Revocable Trust | $188,683 | |
| Closed | Busse Richard J | $143,920 | |
| Closed | Busse Richard J | $35,900 |
Source: Public Records
Tax History Compared to Growth
Tax History
| Year | Tax Paid | Tax Assessment Tax Assessment Total Assessment is a certain percentage of the fair market value that is determined by local assessors to be the total taxable value of land and additions on the property. | Land | Improvement |
|---|---|---|---|---|
| 2025 | $1,464 | $30,890 | -- | -- |
| 2024 | $1,350 | $30,770 | $4,840 | $25,930 |
| 2022 | $1,242 | $22,190 | $4,300 | $17,890 |
| 2021 | $1,347 | $22,830 | $4,430 | $18,400 |
| 2020 | $1,202 | $17,710 | $3,850 | $13,860 |
| 2019 | $1,196 | $17,710 | $3,850 | $13,860 |
| 2018 | $1,100 | $14,990 | $3,240 | $11,750 |
| 2017 | $1,042 | $14,990 | $3,240 | $11,750 |
| 2016 | $829 | $14,300 | $3,340 | $10,960 |
| 2015 | $826 | $14,300 | $3,340 | $10,960 |
| 2014 | $782 | $13,000 | $3,300 | $9,700 |
Source: Public Records
Map
Nearby Homes
- 4742 Villa Cir Unit A
- 4853 Sonata Dr Unit C
- 4858 Sonata Dr Unit D
- 4886 Sonata Dr Unit C
- 4806 Sprucewood Dr
- 4906 Hackamore Dr S
- 872 Naismith Ln
- 889 Old Grotto Dr
- 869 Old Grotto Dr
- 16858 Greyhawk Dr
- 882 Naismith Ln
- 4911 Sonata Dr
- 4518 Misty Dr
- 4434 Misty Dr
- 4380 Saddlewood Dr
- 5015 Bonita Way
- 4410 Moonlight Dr
- 5027 Hackamore Dr N
- 5030 El Camino Dr Unit 8
- 5030 El Camino Dr Unit 1
- 4729 Rincon Place
- 4726 Villa Cir Unit D
- 4726 Villa Cir Unit C
- 4726 Villa Cir Unit B
- 4726 Villa Cir Unit A
- 4726 Villa Cir Unit C
- 4733 Rincon Place
- 4727 Rincon Place
- 4702 Villa Cir Unit D
- 4702 Villa Cir Unit B
- 4702 Villa Cir Unit A
- 4718 Villa Cir Unit D
- 4718 Villa Cir Unit C
- 4718 Villa Cir Unit B
- 4718 Villa Cir Unit A
- 4734 Villa Cir Unit D
- 4734 Villa Cir Unit C
- 4734 Villa Cir Unit B
- 4734 Villa Cir Unit A
- 4734 Villa Cir Unit C