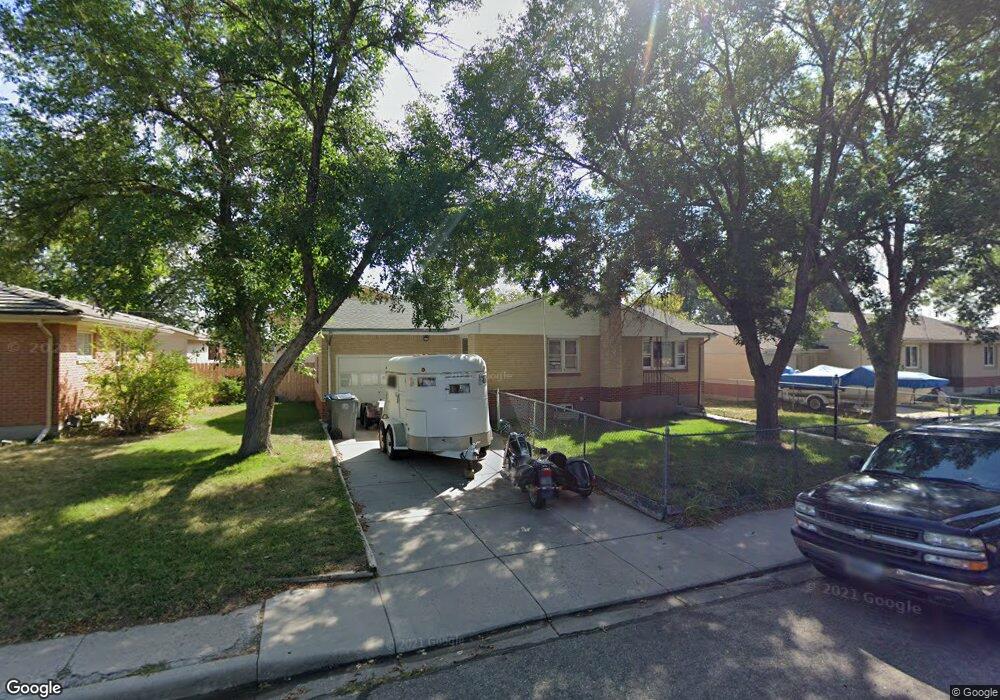
4731 Sagebrush Ave Cheyenne, WY 82009
Estimated Value: $274,000 - $383,000
--
Bed
--
Bath
1,017
Sq Ft
$335/Sq Ft
Est. Value
About This Home
This home is located at 4731 Sagebrush Ave, Cheyenne, WY 82009 and is currently estimated at $340,262, approximately $334 per square foot. 4731 Sagebrush Ave is a home located in Laramie County with nearby schools including Buffalo Ridge Elementary School, Carey Junior High School, and East High School.
Ownership History
Date
Name
Owned For
Owner Type
Purchase Details
Closed on
May 6, 2016
Sold by
Waggener Joshua R
Bought by
Apodaca Peter and Blumanthal Amber
Current Estimated Value
Home Financials for this Owner
Home Financials are based on the most recent Mortgage that was taken out on this home.
Original Mortgage
$132,171
Outstanding Balance
$107,679
Interest Rate
4.4%
Mortgage Type
FHA
Estimated Equity
$232,583
Purchase Details
Closed on
Dec 11, 2002
Sold by
Meredith Murphy Mary E and Murphy Brian T
Bought by
Waggener Joshua R
Home Financials for this Owner
Home Financials are based on the most recent Mortgage that was taken out on this home.
Original Mortgage
$132,900
Interest Rate
5.96%
Purchase Details
Closed on
Oct 17, 2001
Sold by
Anderson George Howard and Anderson Susann C
Bought by
Meredith Mary E
Home Financials for this Owner
Home Financials are based on the most recent Mortgage that was taken out on this home.
Original Mortgage
$95,200
Interest Rate
6.85%
Create a Home Valuation Report for This Property
The Home Valuation Report is an in-depth analysis detailing your home's value as well as a comparison with similar homes in the area
Home Values in the Area
Average Home Value in this Area
Purchase History
| Date | Buyer | Sale Price | Title Company |
|---|---|---|---|
| Apodaca Peter | -- | First American Title | |
| Waggener Joshua R | -- | -- | |
| Meredith Mary E | -- | -- |
Source: Public Records
Mortgage History
| Date | Status | Borrower | Loan Amount |
|---|---|---|---|
| Open | Apodaca Peter | $132,171 | |
| Previous Owner | Waggener Joshua R | $132,900 | |
| Previous Owner | Meredith Mary E | $95,200 |
Source: Public Records
Tax History Compared to Growth
Tax History
| Year | Tax Paid | Tax Assessment Tax Assessment Total Assessment is a certain percentage of the fair market value that is determined by local assessors to be the total taxable value of land and additions on the property. | Land | Improvement |
|---|---|---|---|---|
| 2025 | $2,100 | $23,843 | $3,349 | $20,494 |
| 2024 | $2,100 | $29,695 | $4,465 | $25,230 |
| 2023 | $2,087 | $29,513 | $4,465 | $25,048 |
| 2022 | $1,949 | $27,002 | $4,465 | $22,537 |
| 2021 | $1,757 | $24,283 | $4,465 | $19,818 |
| 2020 | $1,616 | $22,407 | $4,465 | $17,942 |
| 2019 | $1,542 | $21,363 | $4,465 | $16,898 |
| 2018 | $1,443 | $20,175 | $3,358 | $16,817 |
| 2017 | $1,352 | $18,740 | $3,358 | $15,382 |
| 2016 | $1,260 | $17,457 | $3,178 | $14,279 |
| 2015 | $1,217 | $16,855 | $3,178 | $13,677 |
| 2014 | $1,126 | $15,490 | $3,178 | $12,312 |
Source: Public Records
Map
Nearby Homes
- 5021 Sagebrush Ave
- 4816 Ridge Rd
- 3315 Dean Paul Dr
- 5040 Greybull Ave
- 5044 Greybull Ave
- 3117 Douglas St
- 5208 Danielle Ct
- 5402 Hilltop Ave
- 5246 Danielle Ct
- 2533 Windmill Rd
- 3716 Everton Dr
- 2529 Windmill Rd
- 3808 Gregg Way Unit 3
- 5260 Shadow Rock Dr
- 5502 Canyon Rd
- 5253 Shadow Rock Dr
- 2507 Pattison Ave Unit 1-4
- 3728 Sunrise Hills Dr
- 3732 Sunrise Hills Dr
- 4900 Mountain Rd
- 4725 Sagebrush Ave
- 4739 Sagebrush Ave
- 360 Gregg Way
- 4747 Sagebrush Ave
- 4719 Sagebrush Ave
- 4738 Hilltop Ave
- 4728 Hilltop Ave
- 4736 Sagebrush Ave
- 4720 Hilltop Ave
- 4730 Sagebrush Ave
- 4740 Sagebrush Ave
- 4726 Sagebrush Ave
- 4753 Sagebrush Ave
- 4711 Sagebrush Ave
- 4748 Hilltop Ave
- 4716 Hilltop Ave
- 4720 Sagebrush Ave
- 4748 Sagebrush Ave
- 4708 Hilltop Ave
- 4759 Sagebrush Ave