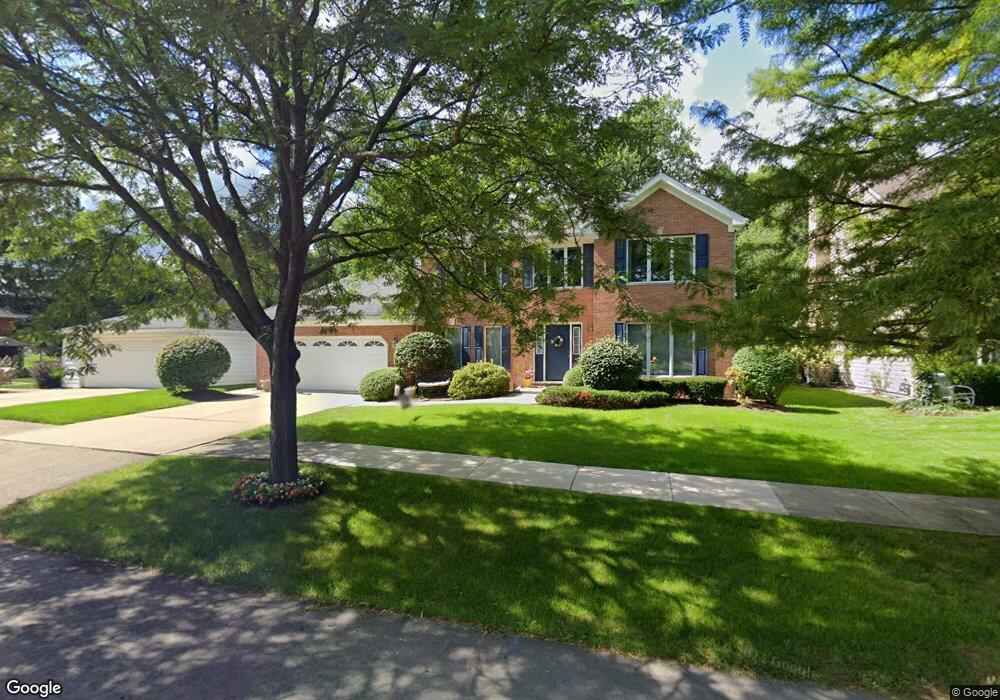
4732 Debolt Ave Downers Grove, IL 60515
Estimated Value: $1,056,537 - $1,228,000
4
Beds
3
Baths
2,996
Sq Ft
$372/Sq Ft
Est. Value
About This Home
This home is located at 4732 Debolt Ave, Downers Grove, IL 60515 and is currently estimated at $1,113,134, approximately $371 per square foot. 4732 Debolt Ave is a home located in DuPage County with nearby schools including Lester Elementary School, Herrick Middle School, and Downer Grove North High School.
Ownership History
Date
Name
Owned For
Owner Type
Purchase Details
Closed on
Jul 19, 2006
Sold by
Zellner Carol M and The Carol M Zellner Trust
Bought by
More Jorge J and More Jeannette S
Current Estimated Value
Home Financials for this Owner
Home Financials are based on the most recent Mortgage that was taken out on this home.
Original Mortgage
$417,000
Outstanding Balance
$30,703
Interest Rate
6.73%
Mortgage Type
Purchase Money Mortgage
Estimated Equity
$1,082,431
Purchase Details
Closed on
Mar 9, 2000
Sold by
Zellner Paul A and Zellner Carol M
Bought by
Zellner Carol M and The Carol M Zellner Trust
Purchase Details
Closed on
May 8, 1996
Sold by
Harris Bank Palatine
Bought by
Zellner Paul A and Zellner Carol M
Home Financials for this Owner
Home Financials are based on the most recent Mortgage that was taken out on this home.
Original Mortgage
$207,000
Interest Rate
7.86%
Create a Home Valuation Report for This Property
The Home Valuation Report is an in-depth analysis detailing your home's value as well as a comparison with similar homes in the area
Home Values in the Area
Average Home Value in this Area
Purchase History
| Date | Buyer | Sale Price | Title Company |
|---|---|---|---|
| More Jorge J | $735,000 | Multiple | |
| Zellner Carol M | -- | -- | |
| Zellner Paul A | $360,000 | -- |
Source: Public Records
Mortgage History
| Date | Status | Borrower | Loan Amount |
|---|---|---|---|
| Open | More Jorge J | $417,000 | |
| Previous Owner | Zellner Paul A | $207,000 |
Source: Public Records
Tax History Compared to Growth
Tax History
| Year | Tax Paid | Tax Assessment Tax Assessment Total Assessment is a certain percentage of the fair market value that is determined by local assessors to be the total taxable value of land and additions on the property. | Land | Improvement |
|---|---|---|---|---|
| 2024 | $15,847 | $292,793 | $74,297 | $218,496 |
| 2023 | $15,049 | $269,160 | $68,300 | $200,860 |
| 2022 | $14,205 | $252,360 | $64,690 | $187,670 |
| 2021 | $13,295 | $249,490 | $63,950 | $185,540 |
| 2020 | $13,048 | $244,550 | $62,680 | $181,870 |
| 2019 | $12,631 | $234,650 | $60,140 | $174,510 |
| 2018 | $12,431 | $228,500 | $59,800 | $168,700 |
| 2017 | $12,034 | $219,880 | $57,540 | $162,340 |
| 2016 | $11,792 | $209,840 | $54,910 | $154,930 |
| 2015 | $11,659 | $197,420 | $51,660 | $145,760 |
| 2014 | $11,370 | $187,380 | $45,660 | $141,720 |
| 2013 | $11,138 | $186,510 | $45,450 | $141,060 |
Source: Public Records
Map
Nearby Homes
- 536 Prairie Ave
- 541 Chicago Ave
- 509 Gierz St
- 727 Grant St
- 416 Chicago Ave
- 420 Wilson St
- 4946 Douglas Rd Unit 202
- 841 Rogers St
- 4533 Highland Ave
- 918 Rogers St Unit 103
- 406 Lincoln Ave
- 312 Prairie Ave
- 543 Burlington Ave Unit 112E
- 342 Maple Ave
- 965 Rogers St Unit 202
- 425 Sherman St
- 5134 Elmwood Ave
- 4929 Forest Ave Unit 4F
- 4900 Forest Ave Unit 108
- 4900 Forest Ave Unit 201
- 4728 Debolt Ave
- 700 Prairie Ave
- 710 Prairie Ave
- 4733 Debolt Ave
- 644 Prairie Ave
- 718 Prairie Ave
- 4729 Debolt Ave
- 640 Prairie Ave
- 4720 Linden Place
- 638 Prairie Ave
- 713 Chicago Ave
- 705 Prairie Ave
- 728 Prairie Ave
- 4804 Stanley Ave
- 633 Gierz St
- 715 Prairie Ave
- 4805 Prospect Ave
- 711 Chicago Ave
- 629 Gierz St
- 717 Chicago Ave