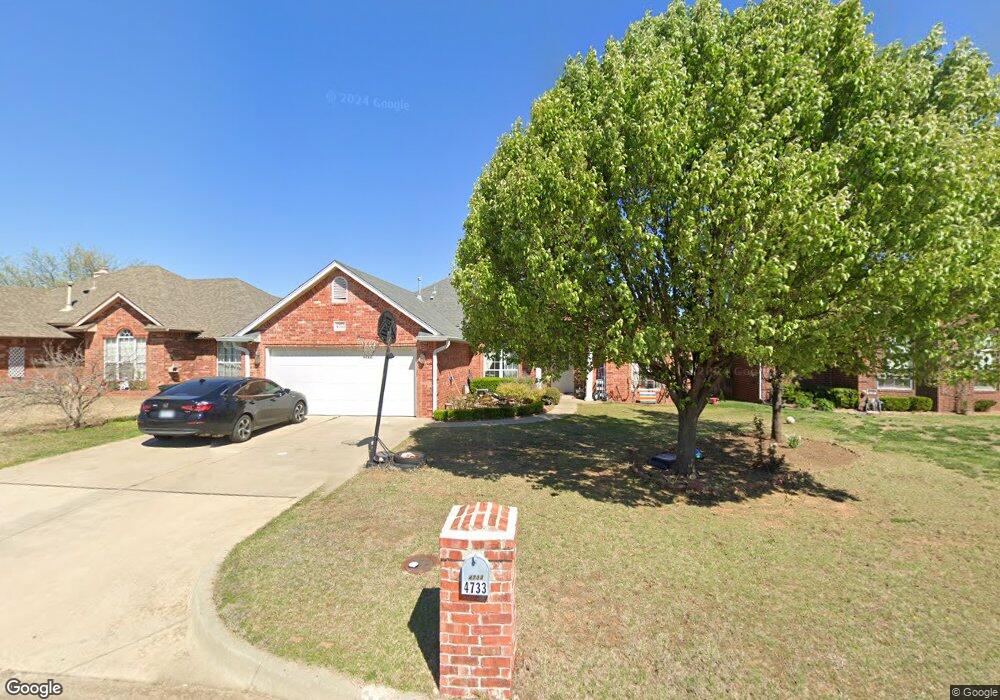
4733 SE 43rd St Oklahoma City, OK 73115
Estimated Value: $233,000 - $246,000
3
Beds
2
Baths
1,728
Sq Ft
$137/Sq Ft
Est. Value
About This Home
This home is located at 4733 SE 43rd St, Oklahoma City, OK 73115 and is currently estimated at $236,802, approximately $137 per square foot. 4733 SE 43rd St is a home located in Oklahoma County with nearby schools including Townsend Elementary School, Kerr Middle School, and Del City High School.
Ownership History
Date
Name
Owned For
Owner Type
Purchase Details
Closed on
Aug 18, 2006
Sold by
Tran Allison and Tran Dung
Bought by
Le Nhan Mau and Vo Niem Thi
Current Estimated Value
Home Financials for this Owner
Home Financials are based on the most recent Mortgage that was taken out on this home.
Original Mortgage
$126,875
Outstanding Balance
$76,298
Interest Rate
6.79%
Mortgage Type
FHA
Estimated Equity
$160,504
Purchase Details
Closed on
May 7, 2001
Sold by
Braden Darinda L
Bought by
Tran Allison and Tran Dung
Create a Home Valuation Report for This Property
The Home Valuation Report is an in-depth analysis detailing your home's value as well as a comparison with similar homes in the area
Home Values in the Area
Average Home Value in this Area
Purchase History
| Date | Buyer | Sale Price | Title Company |
|---|---|---|---|
| Le Nhan Mau | $145,000 | American Guaranty Title Co | |
| Tran Allison | $10,000 | Stewart Escrow & Title |
Source: Public Records
Mortgage History
| Date | Status | Borrower | Loan Amount |
|---|---|---|---|
| Open | Le Nhan Mau | $126,875 |
Source: Public Records
Tax History Compared to Growth
Tax History
| Year | Tax Paid | Tax Assessment Tax Assessment Total Assessment is a certain percentage of the fair market value that is determined by local assessors to be the total taxable value of land and additions on the property. | Land | Improvement |
|---|---|---|---|---|
| 2024 | $2,270 | $21,192 | $2,298 | $18,894 |
| 2023 | $2,270 | $20,183 | $2,424 | $17,759 |
| 2022 | $2,129 | $19,221 | $2,661 | $16,560 |
| 2021 | $2,100 | $18,306 | $2,826 | $15,480 |
| 2020 | $2,053 | $17,435 | $2,512 | $14,923 |
| 2019 | $1,984 | $17,380 | $2,512 | $14,868 |
| 2018 | $1,923 | $16,610 | $0 | $0 |
| 2017 | $1,924 | $16,499 | $2,512 | $13,987 |
| 2016 | $1,945 | $16,225 | $2,277 | $13,948 |
| 2015 | $1,870 | $15,511 | $2,277 | $13,234 |
| 2014 | $1,837 | $15,276 | $2,277 | $12,999 |
Source: Public Records
Map
Nearby Homes
- 4729 SE 43rd St
- 4732 Princess Ln
- 5225 SE 45th Terrace
- 4625 SE 42nd St
- 4113 Vickie Dr
- 4613 SE 41st St
- 4728 SE 45th St
- 4853 Montclair Dr
- 3500 Del View Dr
- 4709 SE 47th St
- 4205 Epperly Dr
- 4704 Tempo Dr
- 3413 Del View Dr
- 4428 SE 39th St
- 4428 SE 38th St
- 4540 SE 35th St
- 5024 Cinder Dr
- 3128 Del View Dr
- 4800 SE 50th St
- 5309 Eden Dr
- 4737 SE 43rd St
- 4741 SE 43rd St
- 4304 Angela Dr
- 4725 SE 43rd St
- 4300 Angela Dr
- 4308 Angela Dr
- 4745 SE 43rd St
- 4736 SE 43rd St
- 4732 SE 43rd St
- 4740 SE 43rd St
- 4728 SE 43rd St
- 4721 SE 43rd St
- 4320 Spiva Dr
- 4744 SE 43rd St
- 4749 SE 43rd St
- 4724 SE 43rd St
- 4245 Angela Dr
- 4316 Angela Dr
- 4312 Spiva Dr
- 4748 SE 43rd St