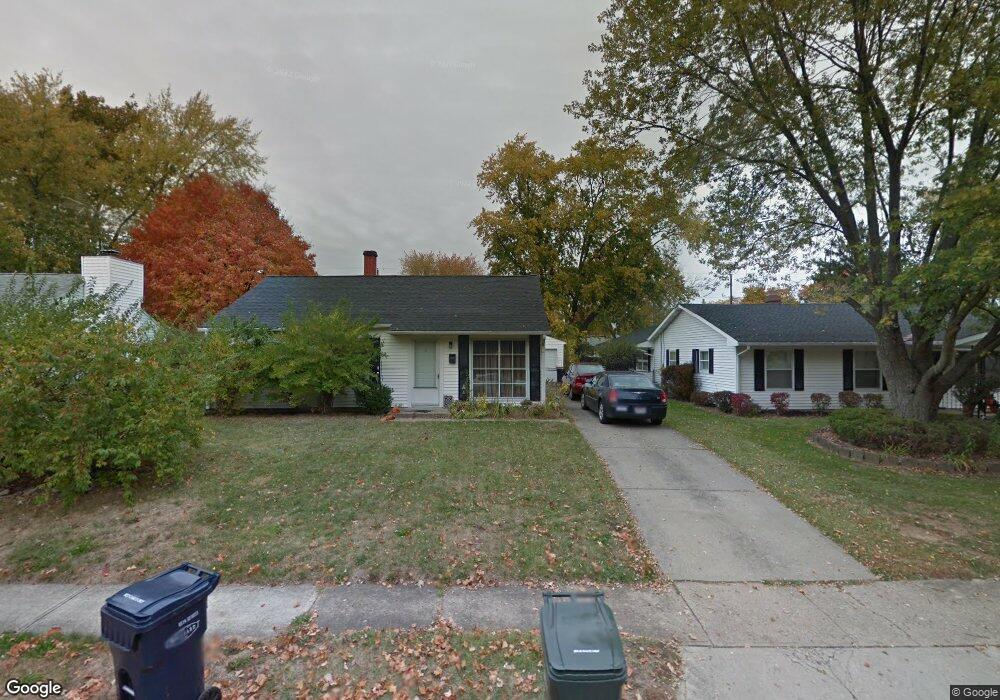
4734 Hillcrest St S Hilliard, OH 43026
Estimated Value: $220,000 - $298,000
3
Beds
1
Bath
1,073
Sq Ft
$250/Sq Ft
Est. Value
About This Home
This home is located at 4734 Hillcrest St S, Hilliard, OH 43026 and is currently estimated at $268,583, approximately $250 per square foot. 4734 Hillcrest St S is a home located in Franklin County with nearby schools including J W Reason Elementary School, Hilliard Station Sixth Grade Elementary School, and Hilliard Heritage Middle School.
Ownership History
Date
Name
Owned For
Owner Type
Purchase Details
Closed on
May 24, 2011
Sold by
Smith Robert S and Smith Patricia A
Bought by
D & B Properties V Llc
Current Estimated Value
Purchase Details
Closed on
Oct 8, 2010
Sold by
Fannie Mae
Bought by
Smith Ryan and Smith Robert S
Purchase Details
Closed on
Jun 10, 2010
Sold by
Kohler Mark D
Bought by
Federal National Mortgage Association
Purchase Details
Closed on
Apr 16, 2004
Sold by
Kohler Kimberly S
Bought by
Kohler Mark D
Purchase Details
Closed on
Apr 28, 1998
Sold by
Inscho Helen M
Bought by
Kohler Mark D and Kohler Kimberly S
Home Financials for this Owner
Home Financials are based on the most recent Mortgage that was taken out on this home.
Original Mortgage
$86,520
Interest Rate
7.18%
Mortgage Type
VA
Create a Home Valuation Report for This Property
The Home Valuation Report is an in-depth analysis detailing your home's value as well as a comparison with similar homes in the area
Home Values in the Area
Average Home Value in this Area
Purchase History
| Date | Buyer | Sale Price | Title Company |
|---|---|---|---|
| D & B Properties V Llc | -- | Attorney | |
| Smith Robert S | -- | Attorney | |
| Smith Ryan | $62,000 | Accutitle Agency Inc | |
| Federal National Mortgage Association | $80,000 | None Available | |
| Kohler Mark D | -- | -- | |
| Kohler Mark D | $84,000 | Independent Title |
Source: Public Records
Mortgage History
| Date | Status | Borrower | Loan Amount |
|---|---|---|---|
| Previous Owner | Kohler Mark D | $86,520 |
Source: Public Records
Tax History Compared to Growth
Tax History
| Year | Tax Paid | Tax Assessment Tax Assessment Total Assessment is a certain percentage of the fair market value that is determined by local assessors to be the total taxable value of land and additions on the property. | Land | Improvement |
|---|---|---|---|---|
| 2024 | $4,634 | $67,800 | $28,040 | $39,760 |
| 2023 | $3,792 | $67,795 | $28,035 | $39,760 |
| 2022 | $3,236 | $46,030 | $16,560 | $29,470 |
| 2021 | $3,234 | $46,030 | $16,560 | $29,470 |
| 2020 | $3,226 | $46,030 | $16,560 | $29,470 |
| 2019 | $2,857 | $34,690 | $12,250 | $22,440 |
| 2018 | $2,934 | $34,690 | $12,250 | $22,440 |
| 2017 | $2,848 | $34,690 | $12,250 | $22,440 |
| 2016 | $3,192 | $35,990 | $10,190 | $25,800 |
| 2015 | $3,020 | $35,990 | $10,190 | $25,800 |
| 2014 | $3,025 | $35,990 | $10,190 | $25,800 |
| 2013 | $1,535 | $35,980 | $10,185 | $25,795 |
Source: Public Records
Map
Nearby Homes
- 3643 Carriage Run Dr
- 4695 Cemetery Rd
- 1774 Zucchina Dr
- 4933 Travers Ct
- 4967 Carroll Ct
- 4863 Berry Leaf Place
- 3661 Patty Ln
- 5137 Drivemere Rd
- 5155 Drivemere Rd
- 5175 Wyandot Place
- 5126 Bigelow Dr
- 5190 Bigelow Dr
- 5220 Conklin Dr
- 3267 Scioto Farms Dr
- 5258 Scioto Darby Rd
- 3255 Reed Point Dr
- 5251 Bigelow Dr
- 4862 Stoneybrook Blvd Unit 24E
- 4857 Stoneybrook Blvd Unit 29E
- 4843 Stoneybrook Blvd Unit 30E
- 4742 Hillcrest St S
- 4718 Hillcrest St S
- 4750 Hillcrest St S
- 4733 Midlane Dr
- 4737 Midlane Dr
- 4725 Midlane Dr
- 4710 Hillcrest St S
- 4756 Hillcrest St S
- 4747 Midlane Dr
- 4741 Hillcrest St S
- 4729 Hillcrest St S
- 4717 Midlane Dr
- 4749 Hillcrest St S
- 4721 Hillcrest St S
- 4755 Midlane Dr
- 4757 Hillcrest St S
- 4709 Midlane Dr
- 4704 Hillcrest St S
- 4711 Hillcrest St S
- 4770 Hillcrest St S