
Seller's Agent in 2024
Mary Richardson
Keller Williams Premier
(918) 697-2707
5 in this area
107 Total Sales
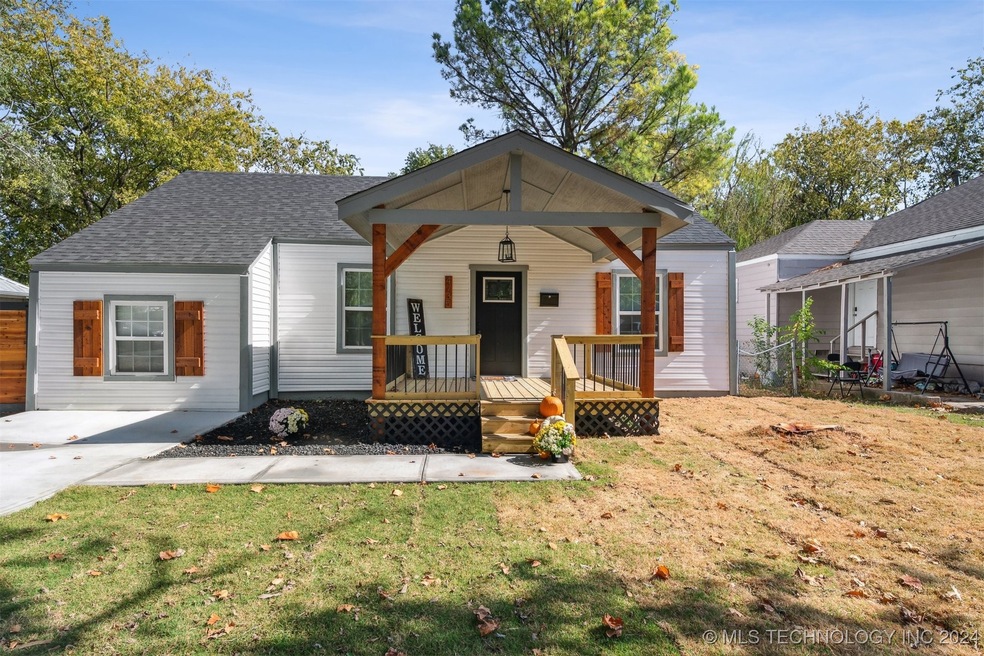
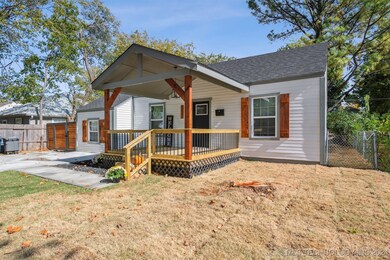
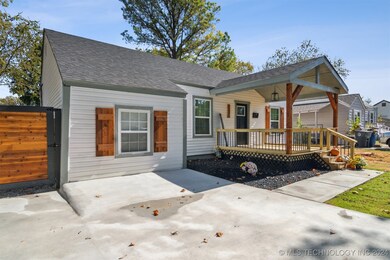
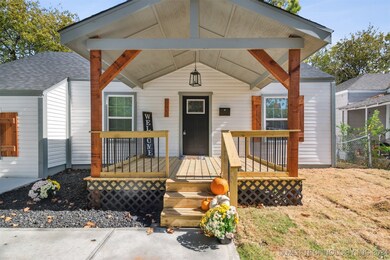
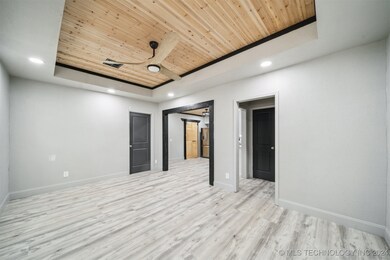
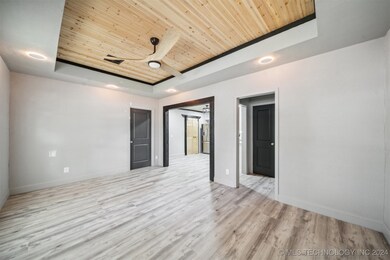
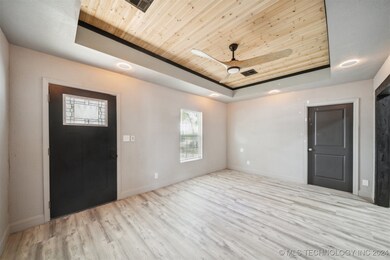
Chic makeover! New roof and windows, interior/exterior paint, fixtures, flooring and granite. New furnace, AC 2023. HW tank newer, stainless appliances. Includes refrigerator! Added insulation. Enjoy both decks on front and back. New driveway that extends behind fencing for additional parking. Storage shed. Large utility room.
Last Agent to Sell the Property
Keller Williams Premier License #159515 Listed on: 10/25/2024
| Date | Type | Sale Price | Title Company |
|---|---|---|---|
| Warranty Deed | $158,000 | Apex Title & Closing Services | |
| Warranty Deed | $46,000 | Apex Title & Closing Services | |
| Warranty Deed | $30,500 | Legacy Title Of Oklahoma |
| Date | Status | Loan Amount | Loan Type |
|---|---|---|---|
| Open | $153,200 | New Conventional |
| Date | Event | Price | List to Sale | Price per Sq Ft | Prior Sale |
|---|---|---|---|---|---|
| 12/02/2024 12/02/24 | Sold | $158,000 | +0.3% | $142 / Sq Ft | |
| 11/10/2024 11/10/24 | Off Market | $157,500 | -- | -- | |
| 11/05/2024 11/05/24 | Pending | -- | -- | -- | |
| 10/29/2024 10/29/24 | Pending | -- | -- | -- | |
| 10/25/2024 10/25/24 | For Sale | $157,500 | +242.4% | $142 / Sq Ft | |
| 07/22/2024 07/22/24 | Sold | $46,000 | -16.2% | $53 / Sq Ft | View Prior Sale |
| 06/28/2024 06/28/24 | Pending | -- | -- | -- | |
| 06/19/2024 06/19/24 | For Sale | $54,900 | -- | $64 / Sq Ft |
| Year | Tax Paid | Tax Assessment Tax Assessment Total Assessment is a certain percentage of the fair market value that is determined by local assessors to be the total taxable value of land and additions on the property. | Land | Improvement |
|---|---|---|---|---|
| 2024 | $894 | $7,394 | $1,649 | $5,745 |
| 2023 | $894 | $7,041 | $1,570 | $5,471 |
| 2022 | $894 | $6,707 | $1,795 | $4,912 |
| 2021 | $844 | $6,387 | $1,709 | $4,678 |
| 2020 | $792 | $6,083 | $1,628 | $4,455 |
| 2019 | $833 | $6,083 | $1,628 | $4,455 |
| 2018 | $835 | $6,083 | $1,628 | $4,455 |
| 2017 | $834 | $6,083 | $1,628 | $4,455 |
| 2016 | $817 | $6,083 | $1,628 | $4,455 |
| 2015 | $818 | $6,083 | $1,628 | $4,455 |
| 2014 | $810 | $6,083 | $1,628 | $4,455 |
Seller's Agent in 2024
Mary Richardson
Keller Williams Premier
(918) 697-2707
5 in this area
107 Total Sales
Seller's Agent in 2024
Courtney Gentry
Dragonfly Realty & Management
(405) 473-2916
2 in this area
201 Total Sales
Buyer's Agent in 2024
Austin Cochran
Cochran & Co Realtors
(918) 697-3889
1 in this area
147 Total Sales
Source: MLS Technology
MLS Number: 2437793
APN: 06625-92-27-06110
Disclaimer: Certain information contained herein is derived from information provided by parties other than Homes.com. All information provided is deemed reliable, but is not guaranteed to be accurate and should be independently verified.
![]() IDX information is provided exclusively for personal, non-commercial use, and may not be used for any purpose other than to identify prospective properties consumers may be interested in purchasing.
IDX information is provided exclusively for personal, non-commercial use, and may not be used for any purpose other than to identify prospective properties consumers may be interested in purchasing.
Information is deemed reliable but not guaranteed.