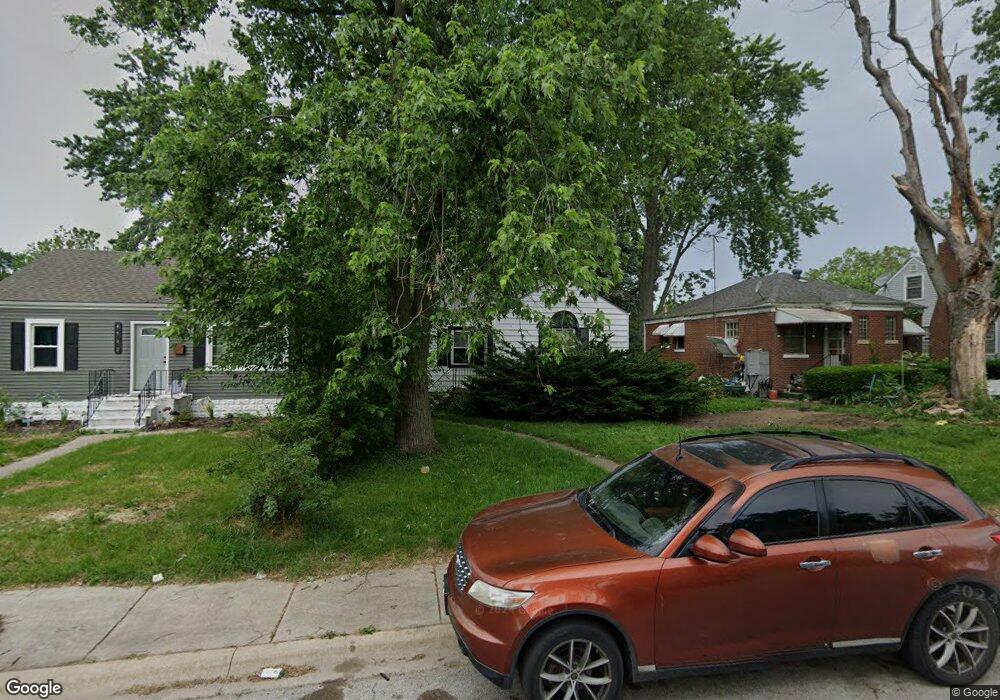
4736 Jackson St Gary, IN 46408
Glen Park NeighborhoodEstimated Value: $83,000 - $139,000
2
Beds
1
Bath
720
Sq Ft
$144/Sq Ft
Est. Value
About This Home
This home is located at 4736 Jackson St, Gary, IN 46408 and is currently estimated at $103,522, approximately $143 per square foot. 4736 Jackson St is a home located in Lake County with nearby schools including Glen Park Academy for Excellence in Learning, Bailly Preparatory Academy, and West Side Leadership Academy.
Ownership History
Date
Name
Owned For
Owner Type
Purchase Details
Closed on
Jun 11, 2016
Sold by
Reed Darlene
Bought by
Realty Rajj
Current Estimated Value
Purchase Details
Closed on
Apr 18, 2016
Sold by
City Equities
Bought by
Reed Darlene
Purchase Details
Closed on
Oct 28, 2011
Sold by
Wontorski Joshua D
Bought by
City Equities
Purchase Details
Closed on
Sep 17, 2008
Sold by
Deutsche Bank Trust Company Americas
Bought by
Wontorski Joshua D
Purchase Details
Closed on
May 2, 2008
Sold by
Haynes Clayton S
Bought by
Deutsche Bank Trust Co Americas and Bankers Trust Co
Purchase Details
Closed on
Jul 13, 2005
Sold by
Peoples Bank Sb
Bought by
Haynes Clayton S
Home Financials for this Owner
Home Financials are based on the most recent Mortgage that was taken out on this home.
Original Mortgage
$64,800
Interest Rate
5.68%
Mortgage Type
Fannie Mae Freddie Mac
Create a Home Valuation Report for This Property
The Home Valuation Report is an in-depth analysis detailing your home's value as well as a comparison with similar homes in the area
Home Values in the Area
Average Home Value in this Area
Purchase History
| Date | Buyer | Sale Price | Title Company |
|---|---|---|---|
| Realty Rajj | -- | None Available | |
| Reed Darlene | -- | None Available | |
| City Equities | $1,500 | None Available | |
| Wontorski Joshua D | -- | None Available | |
| Deutsche Bank Trust Co Americas | $17,000 | None Available | |
| Haynes Clayton S | -- | Chicago Title Insurance Comp |
Source: Public Records
Mortgage History
| Date | Status | Borrower | Loan Amount |
|---|---|---|---|
| Previous Owner | Haynes Clayton S | $64,800 |
Source: Public Records
Tax History
| Year | Tax Paid | Tax Assessment Tax Assessment Total Assessment is a certain percentage of the fair market value that is determined by local assessors to be the total taxable value of land and additions on the property. | Land | Improvement |
|---|---|---|---|---|
| 2025 | $1,748 | $78,100 | $9,900 | $68,200 |
| 2024 | $5,167 | $63,100 | $9,000 | $54,100 |
| 2023 | $1,437 | $58,600 | $9,000 | $49,600 |
| 2022 | $1,437 | $56,000 | $6,000 | $50,000 |
| 2021 | $1,332 | $51,900 | $6,000 | $45,900 |
| 2020 | $1,434 | $55,900 | $6,000 | $49,900 |
| 2019 | $1,343 | $56,000 | $6,100 | $49,900 |
| 2018 | $1,513 | $59,200 | $6,300 | $52,900 |
| 2017 | $1,377 | $63,600 | $6,300 | $57,300 |
| 2016 | $1,520 | $66,300 | $6,300 | $60,000 |
| 2014 | $1,666 | $71,100 | $7,400 | $63,700 |
| 2013 | $1,593 | $70,800 | $7,400 | $63,400 |
Source: Public Records
Map
Nearby Homes
- 4810 Monroe St
- 345 W 47th Ave
- 4647 Harrison St
- 4656 Jefferson Place
- 4525 Tyler St
- 4556 Polk St
- 5033 Jefferson St
- 4601 Buchanan St
- 5069 Jefferson St
- 4585-87 Broadway
- 4383 Monroe St
- 4533 Broadway
- 4525-29 Broadway
- 4778 Connecticut St
- 4788 Connecticut St
- 4427 Washington St
- 4701 Connecticut St
- 4827 Connecticut St
- 4365 Adams St
- 4317 Harrison St
- 4730 Jackson St
- 4742 Jackson St
- 4748 Jackson St
- 4724 Jackson St
- 4754 Jackson St
- 4737 Van Buren St
- 4743 Van Buren St
- 4760 Jackson St
- 4731 Van Buren St
- 4749 Van Buren St
- 4741 Jackson St
- 4755 Van Buren St
- 4731 Jackson St
- 4747 Jackson St
- 611 W 47th Ave
- 601 W 47th Ave
- 4725 Jackson St
- 4749 Jackson St
- 617 W 47th Ave
- 4770 Jackson St
Your Personal Tour Guide
Ask me questions while you tour the home.