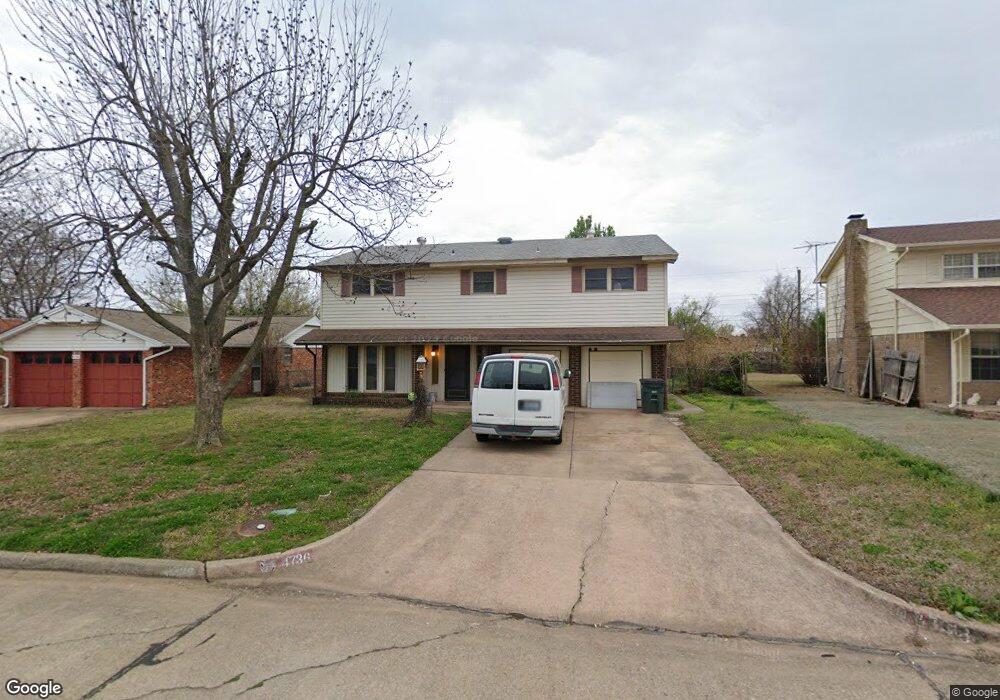
4736 Newport Dr Oklahoma City, OK 73115
Estimated Value: $179,000 - $197,000
4
Beds
3
Baths
1,827
Sq Ft
$104/Sq Ft
Est. Value
About This Home
This home is located at 4736 Newport Dr, Oklahoma City, OK 73115 and is currently estimated at $190,156, approximately $104 per square foot. 4736 Newport Dr is a home located in Oklahoma County with nearby schools including Townsend Elementary School, Kerr Middle School, and Del City High School.
Ownership History
Date
Name
Owned For
Owner Type
Purchase Details
Closed on
May 13, 2009
Sold by
Mohr George Joseph and Mohr Narcissus Charline
Bought by
Gallion Marvin E
Current Estimated Value
Home Financials for this Owner
Home Financials are based on the most recent Mortgage that was taken out on this home.
Original Mortgage
$93,279
Outstanding Balance
$58,650
Interest Rate
4.76%
Mortgage Type
FHA
Estimated Equity
$131,506
Create a Home Valuation Report for This Property
The Home Valuation Report is an in-depth analysis detailing your home's value as well as a comparison with similar homes in the area
Home Values in the Area
Average Home Value in this Area
Purchase History
| Date | Buyer | Sale Price | Title Company |
|---|---|---|---|
| Gallion Marvin E | $95,000 | American Eagle Title Ins Co |
Source: Public Records
Mortgage History
| Date | Status | Borrower | Loan Amount |
|---|---|---|---|
| Open | Gallion Marvin E | $93,279 |
Source: Public Records
Tax History Compared to Growth
Tax History
| Year | Tax Paid | Tax Assessment Tax Assessment Total Assessment is a certain percentage of the fair market value that is determined by local assessors to be the total taxable value of land and additions on the property. | Land | Improvement |
|---|---|---|---|---|
| 2024 | $1,711 | $15,976 | $2,138 | $13,838 |
| 2023 | $1,711 | $15,216 | $2,284 | $12,932 |
| 2022 | $1,605 | $14,492 | $2,364 | $12,128 |
| 2021 | $1,583 | $13,802 | $2,574 | $11,228 |
| 2020 | $1,548 | $13,145 | $2,550 | $10,595 |
| 2019 | $1,510 | $13,224 | $2,463 | $10,761 |
| 2018 | $1,458 | $12,595 | $0 | $0 |
| 2017 | $1,412 | $12,111 | $2,474 | $9,637 |
| 2016 | $1,383 | $11,535 | $2,210 | $9,325 |
| 2015 | $1,324 | $10,985 | $2,195 | $8,790 |
| 2014 | $1,258 | $10,462 | $2,286 | $8,176 |
Source: Public Records
Map
Nearby Homes
- 3413 Del View Dr
- 3128 Del View Dr
- 3500 Del View Dr
- 4700 Elmview Dr
- 4704 Tempo Dr
- 4809 Elmview Dr
- 4813 Elmview Dr
- 4540 SE 35th St
- 4853 Montclair Dr
- 4732 Princess Ln
- 4729 SE 27th St
- 4113 Vickie Dr
- 4809 SE 41st St
- 4428 SE 38th St
- 4428 SE 39th St
- 4625 SE 42nd St
- 4521 SE 27th St
- 4601 SE 26th St
- 4205 Epperly Dr
- 4729 SE 43rd St
- 4732 Newport Dr
- 4744 Newport Dr
- 4728 Newport Dr
- 4737 Del Porte Dr
- 4745 Del Porte Dr
- 4733 Del Porte Dr
- 4733 Newport Dr
- 4749 Del Porte Dr
- 4737 Newport Dr
- 4748 Newport Dr
- 4729 Newport Dr
- 4729 Del Porte Dr
- 4724 Newport Dr
- 4741 Newport Dr
- 4753 Del Porte Dr
- 4725 Newport Dr
- 4725 Del Porte Dr
- 4752 Newport Dr
- 4745 Newport Dr
- 4720 Newport Dr