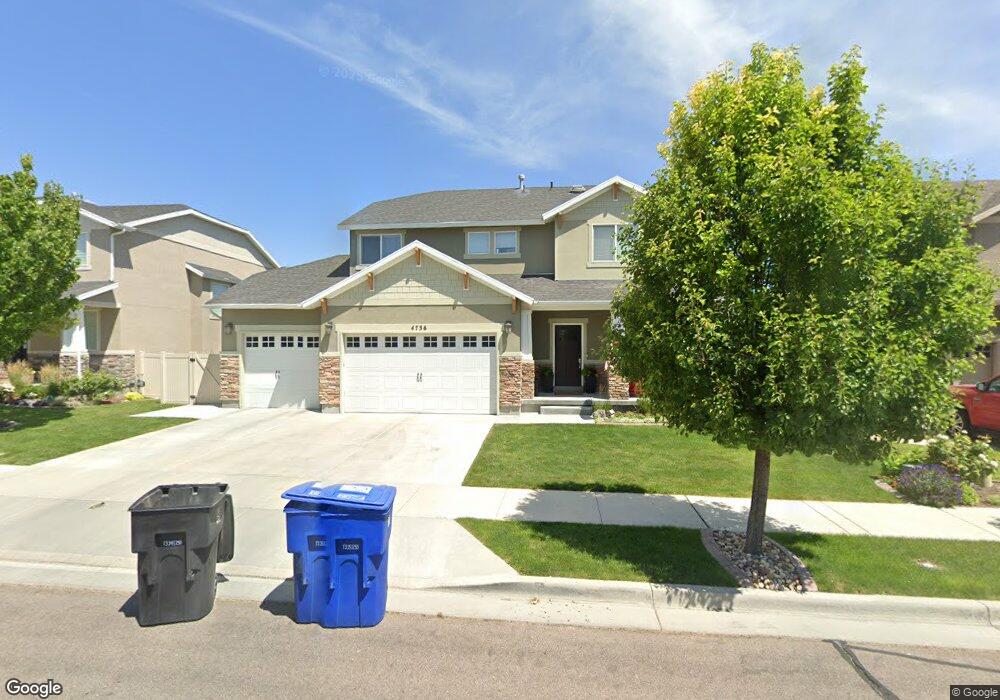
4736 W Plainfield Rd Herriman, UT 84096
Estimated Value: $691,664 - $735,000
4
Beds
3
Baths
2,484
Sq Ft
$288/Sq Ft
Est. Value
About This Home
This home is located at 4736 W Plainfield Rd, Herriman, UT 84096 and is currently estimated at $714,916, approximately $287 per square foot. 4736 W Plainfield Rd is a home with nearby schools including Foothills School, South Hills Middle School, and Mountain Ridge High School.
Ownership History
Date
Name
Owned For
Owner Type
Purchase Details
Closed on
Mar 20, 2020
Sold by
Fugate Reagan N and Fugate Angela J
Bought by
Fugate Ragan and Fugate Angela J
Current Estimated Value
Home Financials for this Owner
Home Financials are based on the most recent Mortgage that was taken out on this home.
Original Mortgage
$257,050
Outstanding Balance
$202,754
Interest Rate
3.4%
Mortgage Type
New Conventional
Estimated Equity
$512,162
Purchase Details
Closed on
Feb 27, 2014
Sold by
Mcarthur Homes 07 Lc
Bought by
Fugate Reagan N and Fugate Angela J
Home Financials for this Owner
Home Financials are based on the most recent Mortgage that was taken out on this home.
Original Mortgage
$287,593
Interest Rate
4.38%
Mortgage Type
New Conventional
Purchase Details
Closed on
Aug 1, 2013
Sold by
Rosecrest Communities Llc
Bought by
Mcarthur Homes 07 Llc
Create a Home Valuation Report for This Property
The Home Valuation Report is an in-depth analysis detailing your home's value as well as a comparison with similar homes in the area
Home Values in the Area
Average Home Value in this Area
Purchase History
| Date | Buyer | Sale Price | Title Company |
|---|---|---|---|
| Fugate Ragan | -- | First American Title | |
| Fugate Reagan N | -- | Surety Title | |
| Mcarthur Homes 07 Llc | -- | Metro National Title |
Source: Public Records
Mortgage History
| Date | Status | Borrower | Loan Amount |
|---|---|---|---|
| Open | Fugate Ragan | $257,050 | |
| Closed | Fugate Reagan N | $287,593 |
Source: Public Records
Tax History Compared to Growth
Tax History
| Year | Tax Paid | Tax Assessment Tax Assessment Total Assessment is a certain percentage of the fair market value that is determined by local assessors to be the total taxable value of land and additions on the property. | Land | Improvement |
|---|---|---|---|---|
| 2025 | $4,012 | $674,700 | $174,700 | $500,000 |
| 2024 | $4,012 | $658,000 | $170,000 | $488,000 |
| 2023 | $4,150 | $644,100 | $166,700 | $477,400 |
| 2022 | $4,258 | $659,000 | $163,400 | $495,600 |
| 2021 | $3,571 | $485,200 | $135,900 | $349,300 |
| 2020 | $3,443 | $440,900 | $123,800 | $317,100 |
| 2019 | $3,375 | $424,900 | $98,000 | $326,900 |
| 2018 | $3,189 | $395,400 | $95,500 | $299,900 |
| 2017 | $3,044 | $373,100 | $95,500 | $277,600 |
| 2016 | $2,951 | $347,000 | $95,500 | $251,500 |
| 2015 | $2,933 | $334,200 | $96,200 | $238,000 |
| 2014 | $1,442 | $161,000 | $91,600 | $69,400 |
Source: Public Records
Map
Nearby Homes
- 4657 W Etonboro Dr
- 4591 W Heritagefield Cir
- 14427 S Attleboro Dr
- 4894 W Chrome Rd Unit 48
- 14649 S Quiet Glen Dr
- 4863 W River Chase Rd
- 14512 S Quiet Shade Dr
- 14272 S Highfield Dr
- 4472 W Lone Shadow Ln
- 14908 S Fawley Ln
- 14397 S Hill Shadow Way Unit 87
- 4472 W Birkdale Dr
- 14558 S Quiet Shade Dr
- 5063 W Arete Way
- 14762 S Desert Sage Dr
- 14933 S Fawley Ln
- 14903 S Mossley Bend Dr
- 4753 Mossley Bend Dr
- 4773 W Mossley Bend Dr
- 4823 W Mossley Bend Dr
- 4744 W Plainfield Rd
- 4716 W Plainfield Rd
- 4729 W Cobblefield Dr Unit 79
- 4729 W Cobblefield Dr
- 4756 W Plainfield Rd Unit LOT 64
- 4756 W Plainfield Rd
- 4737 W Plainfield Rd
- 4727 W Plainfield Rd Unit LOT 56
- 4727 W Plainfield Rd
- 4737 W Cobblefield Dr Unit 80
- 4737 W Cobblefield Dr
- 4719 W Cobblefield Dr Unit 78
- 4719 W Cobblefield Dr
- 14559 S Beaconsfield Cir
- 4717 W Plainfield Rd
- 4747 W Plainfield Rd
- 4706 W Plainfield Rd
- 4707 W Cobblefield Dr
- 14539 S Beaconsfield Cir
- 4768 W Plainfield Rd Unit LOT 63