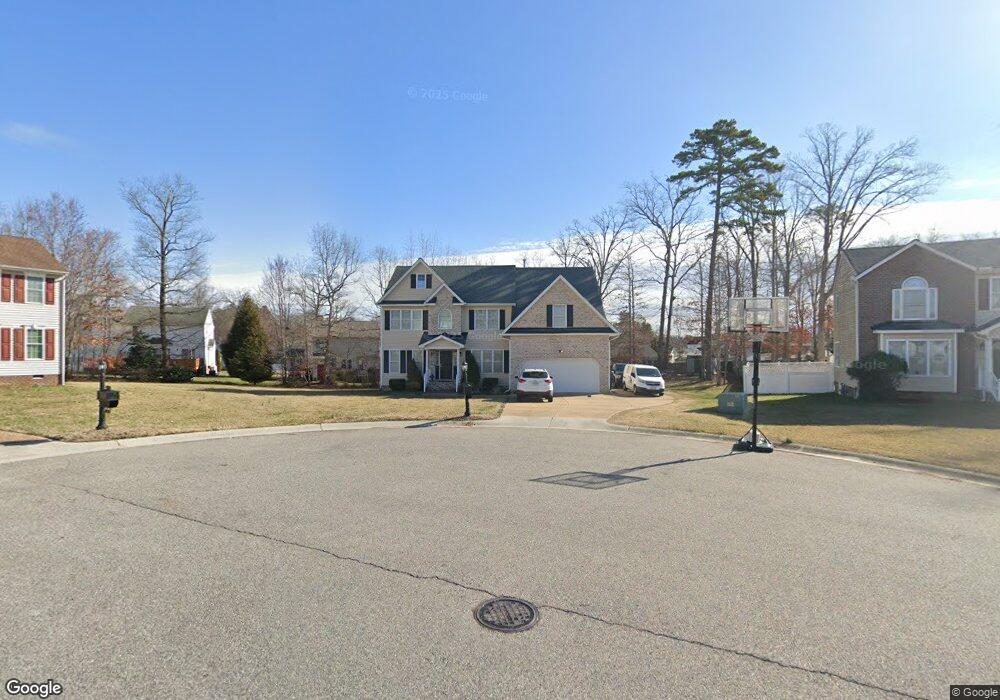
4737 Altimira Ct Unit 9 Midlothian, VA 23112
Estimated Value: $506,000 - $607,000
5
Beds
4
Baths
3,704
Sq Ft
$154/Sq Ft
Est. Value
About This Home
This home is located at 4737 Altimira Ct Unit 9, Midlothian, VA 23112 and is currently estimated at $569,574, approximately $153 per square foot. 4737 Altimira Ct Unit 9 is a home located in Chesterfield County with nearby schools including Thelma Crenshaw Elementary School, Bailey Bridge Middle School, and Manchester High.
Ownership History
Date
Name
Owned For
Owner Type
Purchase Details
Closed on
Nov 1, 2021
Sold by
Hill Erica D
Bought by
Robertson Temara Cherise and Robertson Jamel
Current Estimated Value
Home Financials for this Owner
Home Financials are based on the most recent Mortgage that was taken out on this home.
Original Mortgage
$420,850
Outstanding Balance
$385,043
Interest Rate
2.88%
Mortgage Type
New Conventional
Estimated Equity
$184,531
Purchase Details
Closed on
Nov 16, 2010
Sold by
Finer Homes Inc
Bought by
Hill Erica D
Home Financials for this Owner
Home Financials are based on the most recent Mortgage that was taken out on this home.
Original Mortgage
$337,791
Interest Rate
4.25%
Mortgage Type
VA
Purchase Details
Closed on
Jun 25, 2010
Sold by
Posey Janet Adele and Speeks William Gerald
Bought by
Clay Pointe Development Co Llc
Purchase Details
Closed on
Jun 18, 2010
Sold by
Clay Pointe Development Co Llc
Bought by
Finer Homes Inc
Create a Home Valuation Report for This Property
The Home Valuation Report is an in-depth analysis detailing your home's value as well as a comparison with similar homes in the area
Home Values in the Area
Average Home Value in this Area
Purchase History
| Date | Buyer | Sale Price | Title Company |
|---|---|---|---|
| Robertson Temara Cherise | $443,000 | First American Title | |
| Hill Erica D | $327,000 | -- | |
| Clay Pointe Development Co Llc | $25,000 | -- | |
| Finer Homes Inc | $70,000 | -- |
Source: Public Records
Mortgage History
| Date | Status | Borrower | Loan Amount |
|---|---|---|---|
| Open | Robertson Temara Cherise | $420,850 | |
| Previous Owner | Hill Erica D | $337,791 |
Source: Public Records
Tax History Compared to Growth
Tax History
| Year | Tax Paid | Tax Assessment Tax Assessment Total Assessment is a certain percentage of the fair market value that is determined by local assessors to be the total taxable value of land and additions on the property. | Land | Improvement |
|---|---|---|---|---|
| 2025 | $5,221 | $583,800 | $70,000 | $513,800 |
| 2024 | $5,221 | $574,400 | $68,000 | $506,400 |
| 2023 | $4,626 | $508,300 | $65,000 | $443,300 |
| 2022 | $4,120 | $447,800 | $60,000 | $387,800 |
| 2021 | $4,026 | $416,800 | $60,000 | $356,800 |
| 2020 | $3,839 | $397,300 | $60,000 | $337,300 |
| 2019 | $3,622 | $381,300 | $60,000 | $321,300 |
| 2018 | $3,334 | $358,200 | $55,000 | $303,200 |
| 2017 | $3,214 | $329,600 | $55,000 | $274,600 |
| 2016 | $3,010 | $313,500 | $55,000 | $258,500 |
| 2015 | $2,965 | $306,200 | $55,000 | $251,200 |
| 2014 | $2,904 | $299,900 | $53,000 | $246,900 |
Source: Public Records
Map
Nearby Homes
- 4917 Bailey Woods Ln
- The Rosewood Plan at Cosby Estates
- The Dogwood Plan at Cosby Estates
- The Bradford Plan at Cosby Estates
- The Magnolia Plan at Cosby Estates
- The Busch Plan at Cosby Estates
- The Portsmouth Plan at Cosby Estates
- The Harvick Plan at Cosby Estates
- The Maple Plan at Cosby Estates
- The Azalea Plan at Cosby Estates
- The Hamlin Plan at Cosby Estates
- The Savannah Plan at Cosby Estates
- The Shenandoah Plan at Cosby Estates
- The Audobon Plan at Cosby Estates
- The Burton Plan at Cosby Estates
- 11701 Clear Ridge Dr
- 4706 Parrish Branch Rd
- 11612 Fort Cosby Dr
- 11261 Sunfield Dr
- 12104 Southernbelle Ct
- 4737 Altimira Ct
- 4713 Altimira Ln
- 4713 Altimira Ct
- 11437 Wiltstaff Dr
- 11443 Wiltstaff Dr
- 4700 Altimira Ct
- 11431 Wiltstaff Dr
- 11501 Wiltstaff Dr
- 11518 Alltimira Ln
- 4712 Altimira Ct
- 11518 Altimira Ln
- 4706 Altimira Ln
- 11425 Wiltstaff Dr
- 4706 Altimira Ct
- 11512 Altimira Ln
- 11506 Altimira Ln
- 11507 Wiltstaff Dr
- 11600 Altimira Ln
- 4718 Altimira Ct
- 11436 Wiltstaff Dr