Estimated Value: $403,000 - $477,000
4
Beds
3
Baths
2,613
Sq Ft
$167/Sq Ft
Est. Value
About This Home
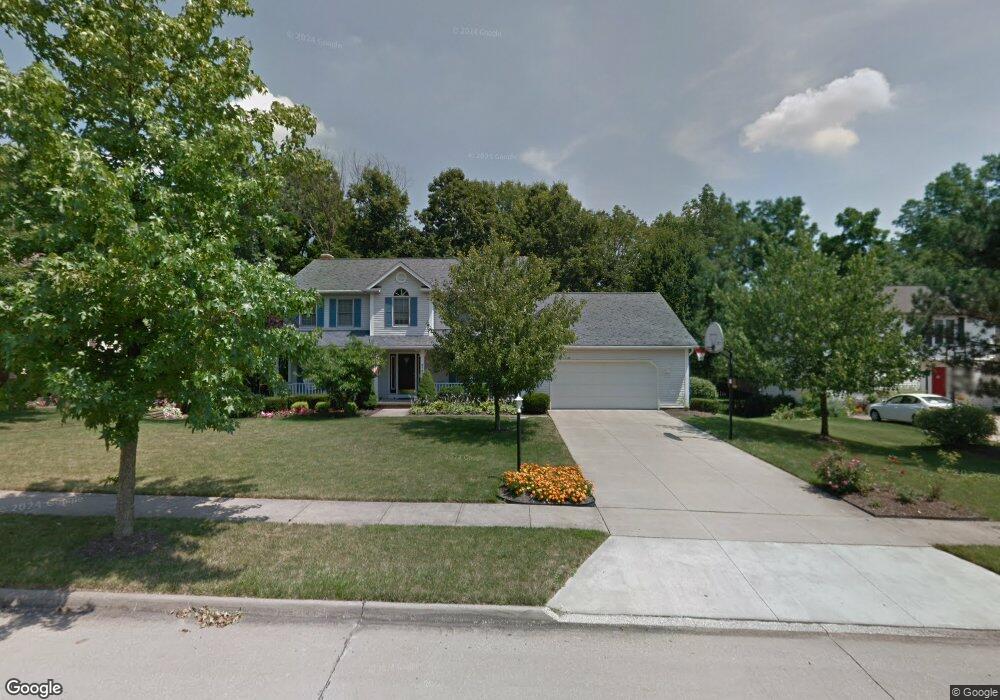
This home is located at 4737 Fox Run Dr, Stow, OH 44224 and is currently estimated at $437,631, approximately $167 per square foot. 4737 Fox Run Dr is a home located in Summit County with nearby schools including Stow-Munroe Falls High School, Primrose School of Hudson, and Holy Family Elementary School.
Ownership History
Date
Name
Owned For
Owner Type
Purchase Details
Closed on
Oct 10, 2005
Sold by
Horton Thomas M and Horton Kathleen
Bought by
Mccaffrey Brian T and Mccaffrey Karen S
Current Estimated Value
Home Financials for this Owner
Home Financials are based on the most recent Mortgage that was taken out on this home.
Original Mortgage
$110,000
Interest Rate
5.83%
Mortgage Type
Fannie Mae Freddie Mac
Purchase Details
Closed on
Aug 10, 1999
Sold by
Burkhardt Gary W and Burkhardt Eva M
Bought by
Horton Thomas M and Horton Kathleen
Home Financials for this Owner
Home Financials are based on the most recent Mortgage that was taken out on this home.
Original Mortgage
$226,000
Interest Rate
7.7%
Mortgage Type
Purchase Money Mortgage
Create a Home Valuation Report for This Property
The Home Valuation Report is an in-depth analysis detailing your home's value as well as a comparison with similar homes in the area
Home Values in the Area
Average Home Value in this Area
Purchase History
| Date | Buyer | Sale Price | Title Company |
|---|---|---|---|
| Mccaffrey Brian T | $263,000 | Prescott Revere Land Title | |
| Horton Thomas M | $226,000 | Resource Title Agency Inc |
Source: Public Records
Mortgage History
| Date | Status | Borrower | Loan Amount |
|---|---|---|---|
| Closed | Mccaffrey Brian T | $110,000 | |
| Previous Owner | Horton Thomas M | $226,000 |
Source: Public Records
Tax History Compared to Growth
Tax History
| Year | Tax Paid | Tax Assessment Tax Assessment Total Assessment is a certain percentage of the fair market value that is determined by local assessors to be the total taxable value of land and additions on the property. | Land | Improvement |
|---|---|---|---|---|
| 2025 | $6,203 | $110,303 | $17,108 | $93,195 |
| 2024 | $6,203 | $110,303 | $17,108 | $93,195 |
| 2023 | $6,203 | $110,303 | $17,108 | $93,195 |
| 2022 | $6,326 | $99,428 | $15,414 | $84,014 |
| 2021 | $5,662 | $99,428 | $15,414 | $84,014 |
| 2020 | $5,564 | $99,420 | $15,410 | $84,010 |
| 2019 | $5,439 | $90,840 | $15,260 | $75,580 |
| 2018 | $5,350 | $90,840 | $15,260 | $75,580 |
| 2017 | $4,936 | $90,840 | $15,260 | $75,580 |
| 2016 | $5,081 | $81,400 | $15,260 | $66,140 |
| 2015 | $4,936 | $81,400 | $15,260 | $66,140 |
| 2014 | $4,941 | $81,400 | $15,260 | $66,140 |
| 2013 | $4,745 | $78,650 | $15,260 | $63,390 |
Source: Public Records
Map
Nearby Homes
- 4917 Independence Cir Unit B
- 4901 Pebblehurst Dr
- 4901 Independence Cir Unit B
- 2444 Port Charles Dr
- 2380 Port Williams Dr Unit 2380
- 4621 Graford Ln
- 2327 Crockett Cir
- 4731 Haughton Ct
- 2418 Wrens Dr S Unit G
- 0 Stow Rd Unit 5102979
- 4903 Fishcreek Rd Unit 11B
- 5465 Park Vista Ct
- 5473 Young Rd
- 2140 Woodlawn Cir Unit 2144
- 5431 Diana Lynn Dr
- V/L Norton Rd
- 4233 Smokerise Dr
- 1884 Village Ct Unit X66
- 1627 Cypress Ct
- 2028 Willowdale Dr