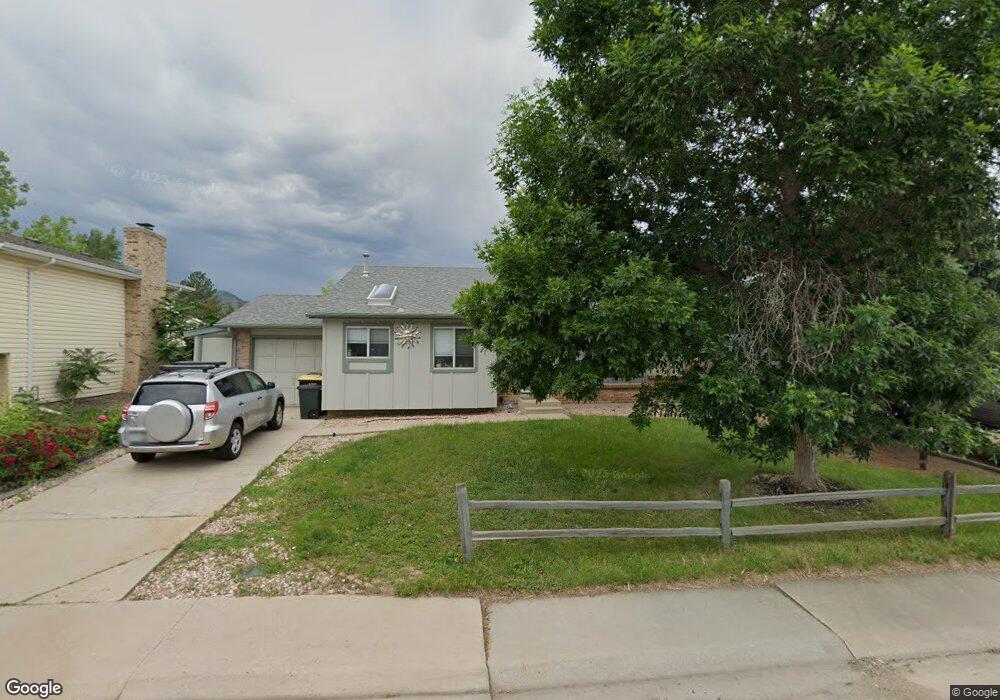
4737 S Xenophon Way Morrison, CO 80465
Friendly Hills NeighborhoodEstimated Value: $540,000 - $592,000
3
Beds
2
Baths
1,551
Sq Ft
$363/Sq Ft
Est. Value
About This Home
This home is located at 4737 S Xenophon Way, Morrison, CO 80465 and is currently estimated at $563,237, approximately $363 per square foot. 4737 S Xenophon Way is a home located in Jefferson County with nearby schools including Kendallvue Elementary School, Carmody Middle School, and Bear Creek High School.
Ownership History
Date
Name
Owned For
Owner Type
Purchase Details
Closed on
Jan 27, 2022
Sold by
David Bailey
Bought by
Reiter Chelsea and Ellinghausen Ryan
Current Estimated Value
Home Financials for this Owner
Home Financials are based on the most recent Mortgage that was taken out on this home.
Original Mortgage
$514,100
Outstanding Balance
$476,800
Interest Rate
3.45%
Mortgage Type
New Conventional
Estimated Equity
$86,437
Purchase Details
Closed on
Dec 15, 2017
Sold by
Brien Bettina E O
Bought by
Bailey Bettina E and Hunter Bailey Kathleen
Home Financials for this Owner
Home Financials are based on the most recent Mortgage that was taken out on this home.
Original Mortgage
$260,000
Interest Rate
3.94%
Mortgage Type
New Conventional
Purchase Details
Closed on
Feb 8, 2000
Sold by
Dienstbach Alice and Dienstbach Fred
Bought by
Obrien Bettina E
Purchase Details
Closed on
Oct 28, 1994
Sold by
Serazio Stephen C
Bought by
Dienstbach Alice and Dienstbach Fred
Create a Home Valuation Report for This Property
The Home Valuation Report is an in-depth analysis detailing your home's value as well as a comparison with similar homes in the area
Home Values in the Area
Average Home Value in this Area
Purchase History
| Date | Buyer | Sale Price | Title Company |
|---|---|---|---|
| Reiter Chelsea | $530,000 | First American Mortgage Soluti | |
| Bailey Bettina E | $325,000 | Prestige Title & Escrow | |
| Obrien Bettina E | -- | -- | |
| Dienstbach Alice | $109,000 | Land Title |
Source: Public Records
Mortgage History
| Date | Status | Borrower | Loan Amount |
|---|---|---|---|
| Open | Reiter Chelsea | $514,100 | |
| Previous Owner | Bailey Bettina E | $260,000 |
Source: Public Records
Tax History Compared to Growth
Tax History
| Year | Tax Paid | Tax Assessment Tax Assessment Total Assessment is a certain percentage of the fair market value that is determined by local assessors to be the total taxable value of land and additions on the property. | Land | Improvement |
|---|---|---|---|---|
| 2024 | $2,936 | $29,982 | $9,086 | $20,896 |
| 2023 | $2,936 | $29,982 | $9,086 | $20,896 |
| 2022 | $2,478 | $24,839 | $7,592 | $17,247 |
| 2021 | $2,509 | $25,553 | $7,810 | $17,743 |
| 2020 | $2,165 | $22,095 | $5,722 | $16,373 |
| 2019 | $2,138 | $22,095 | $5,722 | $16,373 |
| 2018 | $2,050 | $20,462 | $6,483 | $13,979 |
| 2017 | $1,871 | $20,462 | $6,483 | $13,979 |
| 2016 | $1,648 | $17,389 | $4,955 | $12,434 |
| 2015 | $1,446 | $17,389 | $4,955 | $12,434 |
| 2014 | $1,446 | $14,305 | $4,594 | $9,711 |
Source: Public Records
Map
Nearby Homes
- 13018 W Marlowe Ave
- 4816 S Zang Way
- 4921 S Wright Ct
- 12593 W Grand Dr
- 12234 W Saratoga Ave
- 4420 S Vivian Way
- 4416 S Vivian St
- 4726 S Taft St
- 11891 W Stanford Place
- 4467 S Coors St
- 5005 S Braun St
- 4688 S Swadley Way
- 5005 S Cole Ct
- 4309 S Cole Ct
- 13676 W Grand Dr
- 4287 S Cole St
- 4275 S Braun Ct
- 5400 S Alkire St
- 5314 S Youngfield Ct
- 4570 S Swadley Ct
- 4747 S Xenophon Way
- 4727 S Xenophon Way
- 4757 S Xenophon Way
- 4728 S Youngfield St
- 4746 S Xenophon Way
- 4736 S Xenophon Way
- 4756 S Xenophon Way
- 4767 S Xenophon Way
- 4729 S Youngfield St
- 4732 S Youngfield St
- 4766 S Xenophon Way
- 4777 S Xenophon Way
- 4733 S Youngfield St
- 12765 W Temple Dr
- 4774 S Yank Way
- 4776 S Xenophon Way
- 4749 S Xenophon St
- 4739 S Xenophon St
- 4738 S Youngfield St
- 4787 S Xenophon Way