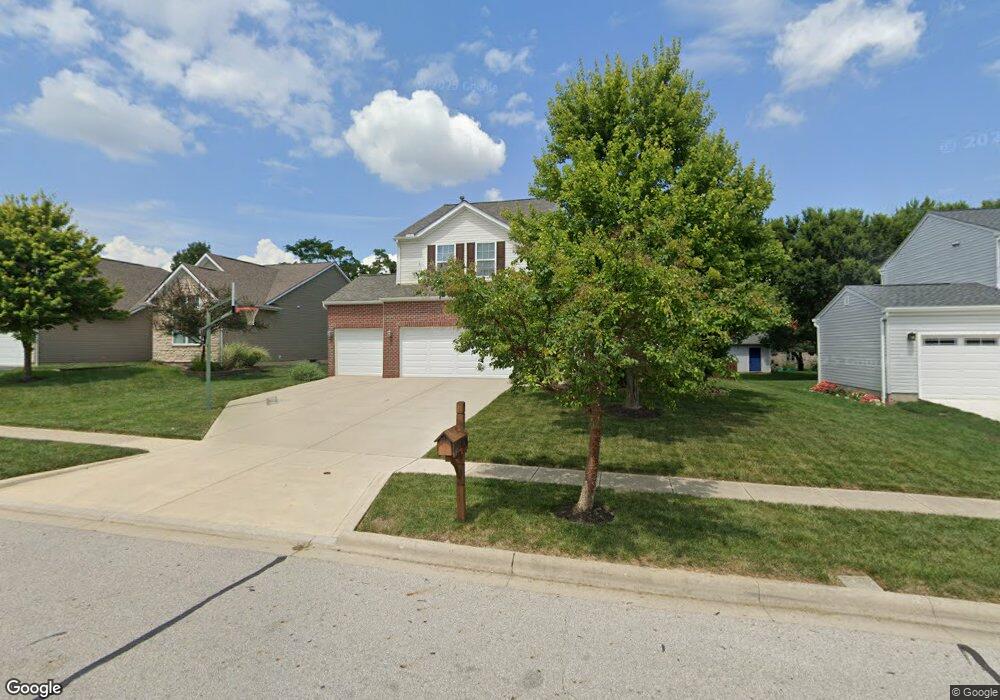
4738 Adwell Loop Grove City, OH 43123
Estimated Value: $433,000 - $478,000
4
Beds
3
Baths
2,606
Sq Ft
$177/Sq Ft
Est. Value
About This Home
This home is located at 4738 Adwell Loop, Grove City, OH 43123 and is currently estimated at $460,514, approximately $176 per square foot. 4738 Adwell Loop is a home located in Franklin County with nearby schools including Hayes Intermediate School, Jc Sommer Elementary School, and Jackson Middle School.
Ownership History
Date
Name
Owned For
Owner Type
Purchase Details
Closed on
Apr 30, 2010
Sold by
Primacy Closing Corporation
Bought by
Joreski Eric J and Joreski Deborah L
Current Estimated Value
Home Financials for this Owner
Home Financials are based on the most recent Mortgage that was taken out on this home.
Original Mortgage
$156,400
Outstanding Balance
$104,829
Interest Rate
5.05%
Mortgage Type
New Conventional
Estimated Equity
$355,685
Purchase Details
Closed on
Feb 24, 2010
Sold by
Harper Ryan P and Harper Christine T
Bought by
Primacy Closing Corporation
Home Financials for this Owner
Home Financials are based on the most recent Mortgage that was taken out on this home.
Original Mortgage
$19,550
Interest Rate
5.3%
Mortgage Type
Stand Alone Second
Purchase Details
Closed on
Jan 31, 2008
Sold by
Centex Homes
Bought by
Harper Ryan P and Harper Christine T
Home Financials for this Owner
Home Financials are based on the most recent Mortgage that was taken out on this home.
Original Mortgage
$151,650
Interest Rate
6.22%
Mortgage Type
Purchase Money Mortgage
Purchase Details
Closed on
Apr 5, 2005
Sold by
Andrews Terry E
Bought by
Centex Homes
Create a Home Valuation Report for This Property
The Home Valuation Report is an in-depth analysis detailing your home's value as well as a comparison with similar homes in the area
Home Values in the Area
Average Home Value in this Area
Purchase History
| Date | Buyer | Sale Price | Title Company |
|---|---|---|---|
| Joreski Eric J | $195,500 | Fati | |
| Primacy Closing Corporation | $191,500 | Fati | |
| Harper Ryan P | $189,600 | Talon Group | |
| Centex Homes | -- | -- | |
| Andrews Terry E | -- | -- |
Source: Public Records
Mortgage History
| Date | Status | Borrower | Loan Amount |
|---|---|---|---|
| Open | Joreski Eric J | $156,400 | |
| Previous Owner | Primacy Closing Corporation | $19,550 | |
| Previous Owner | Harper Ryan P | $151,650 |
Source: Public Records
Tax History Compared to Growth
Tax History
| Year | Tax Paid | Tax Assessment Tax Assessment Total Assessment is a certain percentage of the fair market value that is determined by local assessors to be the total taxable value of land and additions on the property. | Land | Improvement |
|---|---|---|---|---|
| 2024 | $5,851 | $128,660 | $36,750 | $91,910 |
| 2023 | $5,768 | $128,660 | $36,750 | $91,910 |
| 2022 | $6,617 | $108,510 | $19,220 | $89,290 |
| 2021 | $6,745 | $108,510 | $19,220 | $89,290 |
| 2020 | $6,723 | $108,510 | $19,220 | $89,290 |
| 2019 | $5,996 | $89,780 | $16,030 | $73,750 |
| 2018 | $5,608 | $89,250 | $16,030 | $73,220 |
| 2017 | $5,679 | $89,250 | $16,030 | $73,220 |
| 2016 | $5,442 | $75,080 | $12,810 | $62,270 |
| 2015 | $5,278 | $72,800 | $12,810 | $59,990 |
| 2014 | $5,282 | $72,800 | $12,810 | $59,990 |
| 2013 | $2,374 | $69,335 | $12,215 | $57,120 |
Source: Public Records
Map
Nearby Homes
- 3300 Belgreen Dr
- 4838 Adwell Loop
- 3195 Longridge Way
- 4208 Mayfair Ct N
- 3234 Callie Marie Dr
- 3022 Crabapple Place Unit 4
- 4922 Wind Crest Ln
- Newport Plan at Holton Run - Woodside at Holton Run
- Cambridge Plan at Holton Run - Woodside at Holton Run
- 4598 Gillenbury Loop W
- 5170 Bradstone Loop
- 4793 Woodside Dr Unit 56
- 3575 Artberry Way Unit 42
- 4879 Blossom Way Unit 41
- Edgewood Plan at Holton Run
- Palmetto Plan at Holton Run
- Galveston Plan at Holton Run
- Manchester Plan at Holton Run
- McKenzie Plan at Holton Run
- Sanibel Plan at Holton Run
- 4728 Adwell Loop
- 4748 Adwell Loop
- 4748 Adwell Loop Unit 115
- 4718 Adwell Loop
- 4758 Adwell Loop
- 4758 Adwell Loop Unit 116
- 4731 Adwell Loop
- 4741 Adwell Loop
- 3801 Mayfair Dr
- 4721 Adwell Loop
- 4751 Adwell Loop
- 4708 Adwell Loop
- 4768 Adwell Loop
- 4711 Adwell Loop
- 4711 Adwell Loop Unit 82
- 4761 Adwell Loop
- 3789 Mayfair Dr
- 3805 Mayfair Dr
- 4698 Adwell Loop
- 4778 Adwell Loop