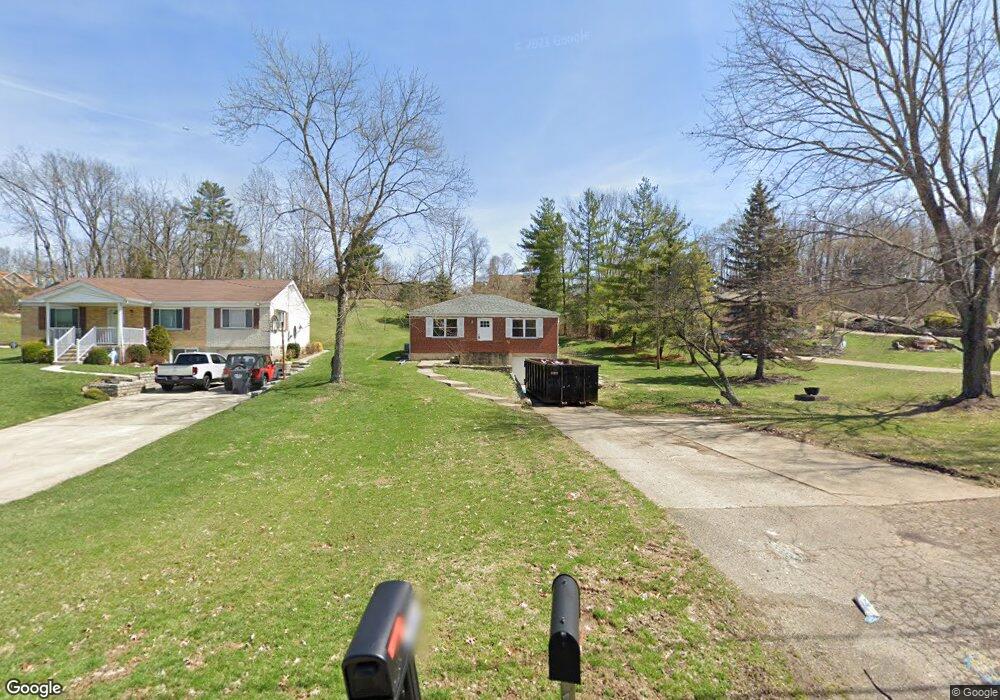
4738 Ebenezer Rd Cincinnati, OH 45248
Estimated Value: $259,438 - $324,000
3
Beds
2
Baths
1,312
Sq Ft
$218/Sq Ft
Est. Value
About This Home
This home is located at 4738 Ebenezer Rd, Cincinnati, OH 45248 and is currently estimated at $286,110, approximately $218 per square foot. 4738 Ebenezer Rd is a home located in Hamilton County with nearby schools including Charles W Springmyer Elementary School, Bridgetown Middle School, and Oak Hills High School.
Ownership History
Date
Name
Owned For
Owner Type
Purchase Details
Closed on
Oct 29, 2019
Sold by
Equity Trust Company
Bought by
Brucato Anthony J
Current Estimated Value
Home Financials for this Owner
Home Financials are based on the most recent Mortgage that was taken out on this home.
Original Mortgage
$151,600
Interest Rate
3.6%
Mortgage Type
New Conventional
Purchase Details
Closed on
Nov 30, 2018
Sold by
Johnson Ronald P
Bought by
Equity Trust Co and 200243271 Ira
Purchase Details
Closed on
Jan 7, 2004
Sold by
Johnson Karen and Johnson Ronald P
Bought by
Johnson Ronald P
Create a Home Valuation Report for This Property
The Home Valuation Report is an in-depth analysis detailing your home's value as well as a comparison with similar homes in the area
Home Values in the Area
Average Home Value in this Area
Purchase History
| Date | Buyer | Sale Price | Title Company |
|---|---|---|---|
| Brucato Anthony J | $189,500 | None Available | |
| Equity Trust Co | $85,000 | None Available | |
| Johnson Ronald P | -- | Chicago Title Insurance Comp |
Source: Public Records
Mortgage History
| Date | Status | Borrower | Loan Amount |
|---|---|---|---|
| Previous Owner | Brucato Anthony J | $151,600 |
Source: Public Records
Tax History
| Year | Tax Paid | Tax Assessment Tax Assessment Total Assessment is a certain percentage of the fair market value that is determined by local assessors to be the total taxable value of land and additions on the property. | Land | Improvement |
|---|---|---|---|---|
| 2025 | $3,544 | $67,935 | $13,734 | $54,201 |
| 2024 | $3,457 | $67,935 | $13,734 | $54,201 |
| 2023 | $3,459 | $67,935 | $13,734 | $54,201 |
| 2022 | $3,980 | $66,325 | $13,391 | $52,934 |
| 2021 | $3,575 | $66,325 | $13,391 | $52,934 |
| 2020 | $3,621 | $66,325 | $13,391 | $52,934 |
| 2019 | $2,349 | $39,144 | $11,956 | $27,188 |
| 2018 | $2,352 | $39,144 | $11,956 | $27,188 |
| 2017 | $2,218 | $39,144 | $11,956 | $27,188 |
| 2016 | $1,754 | $30,878 | $11,358 | $19,520 |
| 2015 | $1,769 | $30,878 | $11,358 | $19,520 |
| 2014 | $1,771 | $30,878 | $11,358 | $19,520 |
| 2013 | $1,742 | $32,505 | $11,956 | $20,549 |
Source: Public Records
Map
Nearby Homes
- 6419 Louese Ln
- 6989 Carlinridge Ln
- 5703 Irwin Dr
- 5779 Irwin Dr
- 5771 Irwin Dr
- 5767 Irwin Dr
- 3105 Laurel Hill Ln
- 4510 Clearwater Place
- 4512 Clearwater Place
- 6289 Eagles Lake Dr
- 6074 Johnson Rd
- 6321 Eagles Lake Dr Unit 19
- 6646 Hearne Rd
- 5104 Jonkard Ln
- 5207 S Eaglesnest Dr
- 1 Hutchinson Rd
- 4181 Hutchinson Rd
- 6617 Hearne Rd
- 4911 N Arbor Woods Ct
- 5221 Clearlake Dr
- 4740 Ebenezer Rd
- 4750 Ebenezer Rd
- 4730 Ebenezer Rd
- 4758 Ebenezer Rd
- 4768 Ebenezer Rd
- 4739 Ebenezer Rd
- 4727 Ebenezer Rd
- 4751 Ebenezer Rd
- 4698 Ebenezer Rd
- 4689 Hampton Pointe Dr
- 4715 Ebenezer Rd
- 4763 Ebenezer Rd
- 4722 Ebenezer Rd
- 4685 Hampton Pointe Dr
- 4762 Ebenezer Rd
- 4703 Ebenezer Rd
- 4680 Ebenezer Rd
- 4766 Ebenezer Rd
- 4693 Hampton Pointe Dr
- 4681 Hampton Pointe Dr
Your Personal Tour Guide
Ask me questions while you tour the home.