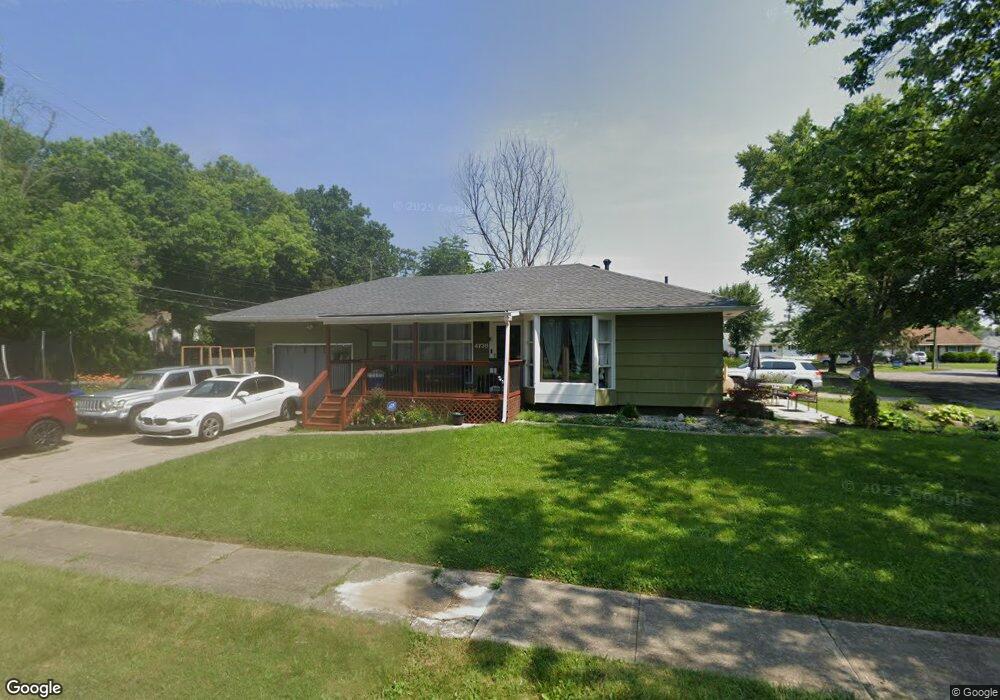
4738 Mcallister Ave Columbus, OH 43227
Shady Lane NeighborhoodEstimated Value: $194,000 - $224,000
3
Beds
2
Baths
990
Sq Ft
$214/Sq Ft
Est. Value
About This Home
This home is located at 4738 Mcallister Ave, Columbus, OH 43227 and is currently estimated at $211,692, approximately $213 per square foot. 4738 Mcallister Ave is a home located in Franklin County with nearby schools including Shady Lane Elementary School, Sherwood Middle School, and Walnut Ridge High School.
Ownership History
Date
Name
Owned For
Owner Type
Purchase Details
Closed on
Oct 17, 2006
Sold by
Kelly Edwin C and Kelly Jennifer
Bought by
Lampley Revieta L
Current Estimated Value
Home Financials for this Owner
Home Financials are based on the most recent Mortgage that was taken out on this home.
Original Mortgage
$80,910
Outstanding Balance
$48,138
Interest Rate
6.5%
Mortgage Type
Purchase Money Mortgage
Estimated Equity
$163,554
Purchase Details
Closed on
Jun 13, 2003
Sold by
Kelly Edwin C and Kelly Jennifer
Bought by
Kelly Edwin C and Kelly Jennifer
Home Financials for this Owner
Home Financials are based on the most recent Mortgage that was taken out on this home.
Original Mortgage
$64,000
Interest Rate
4.86%
Mortgage Type
Purchase Money Mortgage
Purchase Details
Closed on
Jul 17, 1998
Sold by
Mason Mary A
Bought by
Kelly Edwin C
Create a Home Valuation Report for This Property
The Home Valuation Report is an in-depth analysis detailing your home's value as well as a comparison with similar homes in the area
Home Values in the Area
Average Home Value in this Area
Purchase History
| Date | Buyer | Sale Price | Title Company |
|---|---|---|---|
| Lampley Revieta L | $89,900 | Foundation | |
| Kelly Edwin C | -- | Advantage One Title Agency I | |
| Kelly Edwin C | $68,400 | George Pritsolas Title |
Source: Public Records
Mortgage History
| Date | Status | Borrower | Loan Amount |
|---|---|---|---|
| Open | Lampley Revieta L | $80,910 | |
| Previous Owner | Kelly Edwin C | $64,000 |
Source: Public Records
Tax History Compared to Growth
Tax History
| Year | Tax Paid | Tax Assessment Tax Assessment Total Assessment is a certain percentage of the fair market value that is determined by local assessors to be the total taxable value of land and additions on the property. | Land | Improvement |
|---|---|---|---|---|
| 2024 | $2,665 | $59,370 | $16,140 | $43,230 |
| 2023 | $2,630 | $59,360 | $16,135 | $43,225 |
| 2022 | $1,413 | $27,240 | $6,060 | $21,180 |
| 2021 | $1,415 | $27,240 | $6,060 | $21,180 |
| 2020 | $1,417 | $27,240 | $6,060 | $21,180 |
| 2019 | $1,264 | $20,830 | $4,830 | $16,000 |
| 2018 | $1,225 | $20,830 | $4,830 | $16,000 |
| 2017 | $1,287 | $20,830 | $4,830 | $16,000 |
| 2016 | $1,310 | $19,780 | $5,010 | $14,770 |
| 2015 | $1,189 | $19,780 | $5,010 | $14,770 |
| 2014 | $1,192 | $19,780 | $5,010 | $14,770 |
| 2013 | $692 | $23,275 | $5,880 | $17,395 |
Source: Public Records
Map
Nearby Homes
- 1130 Little Plum Ln
- 1085 S Hamilton Rd
- 4991 Justin Rd
- 1068 Ross Rd
- 1281 Maetzel Dr
- 4501 Amesbury Rd
- 1320 Nancy Ln
- 4662 Jae Ave
- 4484 Grimsby Rd
- 931 Antwerp Rd
- 4467 Grimsby Rd
- 4677 E Livingston Ave
- 4653 Kae Ave
- 4571 Aragon Ave
- 1486 Efner Dr
- 855 Dimson Dr E
- 1563 Genoa Place
- 963 Erickson Ave
- 1571 Baxter Dr
- 1607 Shady Lane Rd
- 1083 Lockwood Rd
- 4735 Mcallister Ave
- 1075 Lockwood Rd
- 4756 Mcallister Ave
- 1115 Lockwood Rd
- 1067 Lockwood Rd
- 1078 Lockwood Rd
- 1110 Lockwood Rd
- 1085 Shady Lane Rd
- 4768 Mcallister Ave
- 1123 Lockwood Rd
- 1113 Shady Lane Rd
- 4763 Mcallister Ave
- 1065 Shady Lane Rd
- 1071 Billie Dr
- 1056 Billie Dr
- 1120 Lockwood Rd
- 1058 Billie Dr
- 4778 Mcallister Ave
- 1131 Lockwood Rd