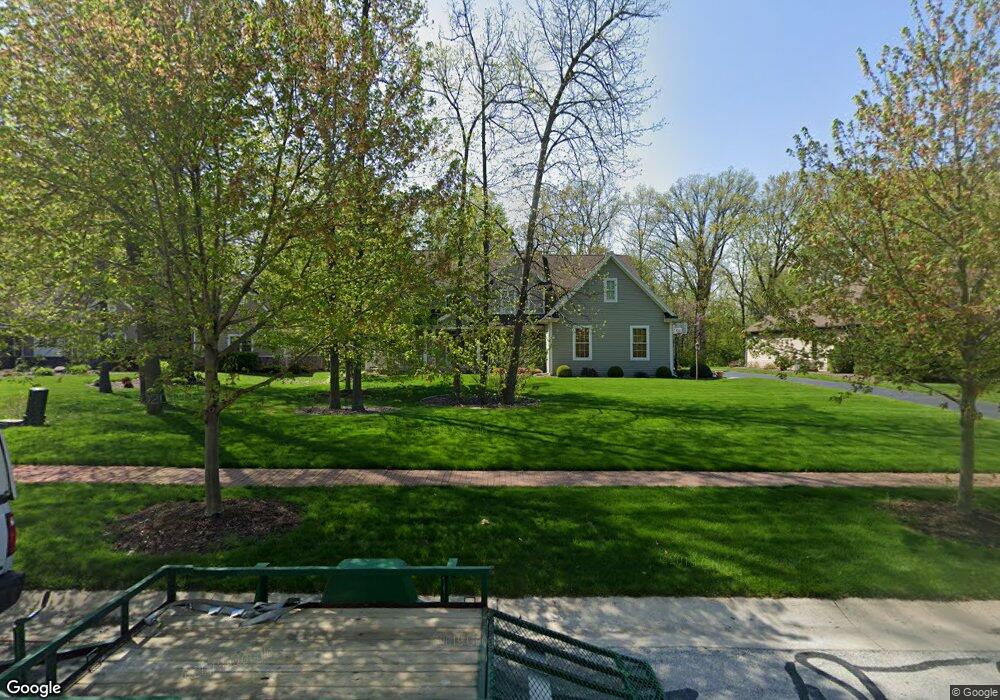
4738 Rhone Dr Maumee, OH 43537
Estimated Value: $534,657 - $630,000
4
Beds
4
Baths
3,269
Sq Ft
$177/Sq Ft
Est. Value
About This Home
This home is located at 4738 Rhone Dr, Maumee, OH 43537 and is currently estimated at $578,664, approximately $177 per square foot. 4738 Rhone Dr is a home located in Lucas County with nearby schools including Anthony Wayne High School, St Joseph Catholic School, and Monclova Christian Academy.
Ownership History
Date
Name
Owned For
Owner Type
Purchase Details
Closed on
Jul 5, 2022
Sold by
Frysinger Rodney D and Frysinger Jodi M
Bought by
Hreka Joshua and Hreka Rebekah Lynn
Current Estimated Value
Home Financials for this Owner
Home Financials are based on the most recent Mortgage that was taken out on this home.
Original Mortgage
$302,500
Outstanding Balance
$286,556
Interest Rate
5.1%
Mortgage Type
VA
Estimated Equity
$292,108
Purchase Details
Closed on
Mar 24, 2009
Sold by
Frysinger Rodney and Frysinger Jodi M
Bought by
Frysinger Rodney D and Frysinger Jodi M
Purchase Details
Closed on
Apr 26, 2005
Sold by
Port Lawrence Title & Trust Co
Bought by
Frysinger Rodney
Home Financials for this Owner
Home Financials are based on the most recent Mortgage that was taken out on this home.
Original Mortgage
$345,657
Interest Rate
6.06%
Mortgage Type
Purchase Money Mortgage
Purchase Details
Closed on
Sep 25, 2003
Sold by
Port Lawrence Title & Trust Co
Bought by
Harbauer Jacqueline J
Create a Home Valuation Report for This Property
The Home Valuation Report is an in-depth analysis detailing your home's value as well as a comparison with similar homes in the area
Home Values in the Area
Average Home Value in this Area
Purchase History
| Date | Buyer | Sale Price | Title Company |
|---|---|---|---|
| Hreka Joshua | $502,500 | Louisville Title | |
| Frysinger Rodney D | -- | Attorney | |
| Frysinger Rodney | $95,000 | -- | |
| Harbauer Jacqueline J | $89,900 | -- |
Source: Public Records
Mortgage History
| Date | Status | Borrower | Loan Amount |
|---|---|---|---|
| Open | Hreka Joshua | $302,500 | |
| Previous Owner | Frysinger Rodney | $345,657 |
Source: Public Records
Tax History
| Year | Tax Paid | Tax Assessment Tax Assessment Total Assessment is a certain percentage of the fair market value that is determined by local assessors to be the total taxable value of land and additions on the property. | Land | Improvement |
|---|---|---|---|---|
| 2025 | -- | $176,785 | $28,980 | $147,805 |
| 2024 | $4,056 | $176,785 | $28,980 | $147,805 |
| 2023 | $6,322 | $126,945 | $23,555 | $103,390 |
| 2022 | $7,378 | $126,945 | $23,555 | $103,390 |
| 2021 | $7,231 | $126,945 | $23,555 | $103,390 |
| 2020 | $7,158 | $112,735 | $20,720 | $92,015 |
| 2019 | $6,955 | $112,735 | $20,720 | $92,015 |
| 2018 | $6,649 | $112,735 | $20,720 | $92,015 |
| 2017 | $6,715 | $102,375 | $19,705 | $82,670 |
| 2016 | $6,650 | $292,500 | $56,300 | $236,200 |
| 2015 | $6,373 | $292,500 | $56,300 | $236,200 |
| 2014 | $6,143 | $99,410 | $19,150 | $80,260 |
| 2013 | $6,143 | $99,410 | $19,150 | $80,260 |
Source: Public Records
Map
Nearby Homes
- 4644 Terra Ct
- 7795 Southbranch Terrace
- 7508 Epaulet Ln
- 0 Black Rd
- 7764 N Woodbridge Rd
- 4455 Post Office Cir
- 7900 Iron Horse Rd
- 5160 Black Rd
- 5002 Black Rd
- 7902 Trestle Bend Rd
- 4369 Post Office Cir
- 7909 Trestle Bend Rd
- 7901 Trestle Bend Rd
- 4346 Post Office Cir
- 4334 Post Office Cir
- 5218 Black Rd
- 4321 Post Office Cir
- 4351 Sage St
- 4339 Sage St
- 4332 Sage St
- 4746 Rhone Dr
- 4726 Rhone Dr
- 4754 Rhone Dr
- 4753 Rhone Dr
- 4733 Rhone Dr
- 000 Rhone Dr
- 4706 Rhone Dr
- 4721 Rhone Dr
- 4764 Rhone Dr
- 4771 Rhone Dr
- 7747 South Branch
- 4774 Rhone Dr
- 4709 Rhone Dr
- 7747 Southbranch Terrace
- 7755 South Branch
- 7755 Southbranch Terrace
- 4674 Rhone Dr
- 7739 South Branch
- 7739 South Branch
- 4804 Rhone Dr
Your Personal Tour Guide
Ask me questions while you tour the home.