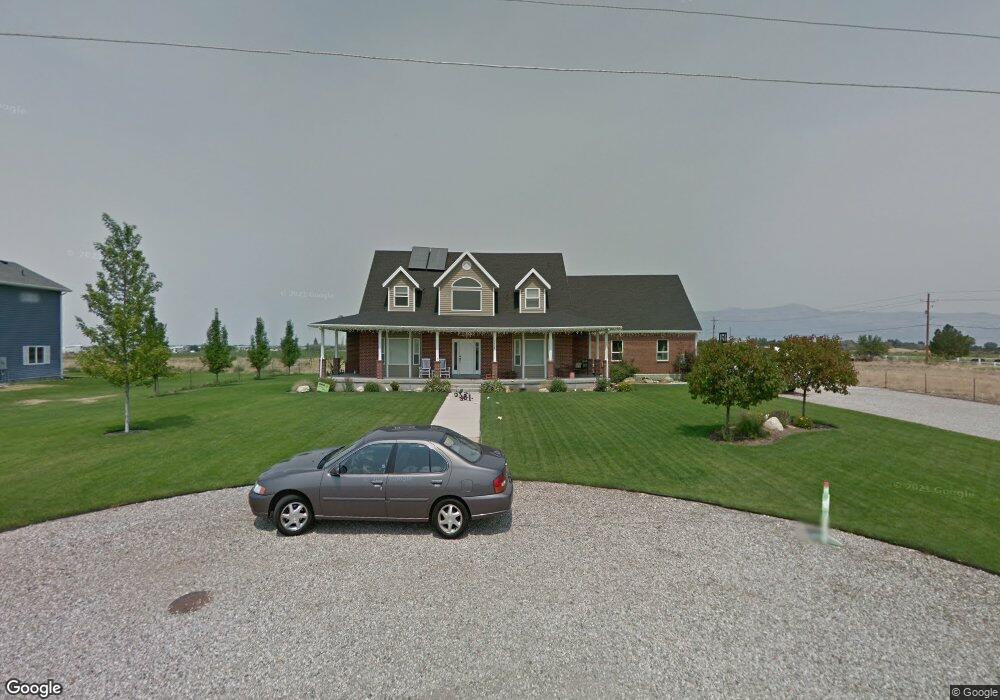
4738 W 3300 S West Haven, UT 84401
Estimated Value: $693,000 - $999,000
4
Beds
3
Baths
2,942
Sq Ft
$298/Sq Ft
Est. Value
About This Home
This home is located at 4738 W 3300 S, West Haven, UT 84401 and is currently estimated at $875,545, approximately $297 per square foot. 4738 W 3300 S is a home located in Weber County with nearby schools including Kanesville Elementary School, Rocky Mountain Junior High School, and Fremont High School.
Ownership History
Date
Name
Owned For
Owner Type
Purchase Details
Closed on
Jul 28, 2010
Sold by
Cooper Ryan Samuel
Bought by
Cooper Ryan Samuel and Cooper Holli A
Current Estimated Value
Home Financials for this Owner
Home Financials are based on the most recent Mortgage that was taken out on this home.
Original Mortgage
$213,000
Outstanding Balance
$142,019
Interest Rate
4.71%
Mortgage Type
New Conventional
Estimated Equity
$733,526
Purchase Details
Closed on
Oct 12, 2005
Sold by
Hansen Carl Myrlin and Hansen Oertel H
Bought by
Cooper Ryan Samuel and Cooper Holli A
Create a Home Valuation Report for This Property
The Home Valuation Report is an in-depth analysis detailing your home's value as well as a comparison with similar homes in the area
Home Values in the Area
Average Home Value in this Area
Purchase History
| Date | Buyer | Sale Price | Title Company |
|---|---|---|---|
| Cooper Ryan Samuel | -- | Mountain View Title Ogden | |
| Cooper Ryan Samuel | -- | Mountain View Title Ogden | |
| Cooper Ryan Samuel | -- | Mountain View Title |
Source: Public Records
Mortgage History
| Date | Status | Borrower | Loan Amount |
|---|---|---|---|
| Open | Cooper Ryan Samuel | $213,000 |
Source: Public Records
Tax History Compared to Growth
Tax History
| Year | Tax Paid | Tax Assessment Tax Assessment Total Assessment is a certain percentage of the fair market value that is determined by local assessors to be the total taxable value of land and additions on the property. | Land | Improvement |
|---|---|---|---|---|
| 2025 | $4,658 | $861,911 | $278,041 | $583,870 |
| 2024 | $4,154 | $431,749 | $119,974 | $311,775 |
| 2023 | $3,998 | $410,300 | $119,975 | $290,325 |
| 2022 | $3,960 | $414,150 | $106,325 | $307,825 |
| 2021 | $3,179 | $560,000 | $83,378 | $476,622 |
| 2020 | $3,217 | $523,000 | $73,289 | $449,711 |
| 2019 | $3,229 | $502,000 | $54,399 | $447,601 |
| 2018 | $3,358 | $501,000 | $51,531 | $449,469 |
| 2017 | $2,953 | $439,000 | $52,313 | $386,687 |
| 2016 | $2,815 | $227,154 | $24,502 | $202,652 |
| 2015 | $2,724 | $217,504 | $24,502 | $193,002 |
| 2014 | $2,479 | $193,427 | $24,127 | $169,300 |
Source: Public Records
Map
Nearby Homes
- 3215 S 4950 W Unit 27
- 3549 S 4450 W
- 3660 S 4700 W
- Altamont Plan at Green Farm - Fields
- Charleston Plan at Green Farm - Fields
- 4464 W 3600 S
- 4941 W 3575 S
- 4381 W 3550 S
- 3678 S 4625 W Unit 225
- 3686 S 4625 W Unit 227
- 3690 S 4625 W Unit 228
- 3495 S 4250 W
- 3535 S 4300 W
- 4622 W 3725 S Unit 231
- 1636 S 4350 W Unit 217
- 4589 W 3725 S Unit 248
- 4585 W 3725 S Unit 246
- 3731 S 4975 W
- 3243 S 4950 W Unit 25
- 3263 S 4950 W Unit 24