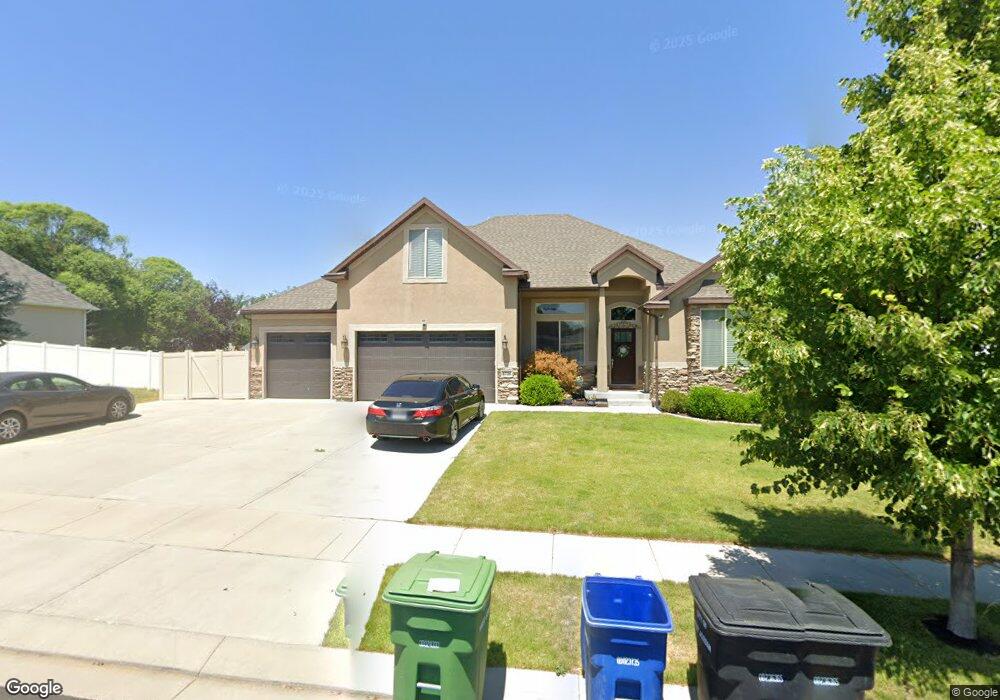
4738 W Baldy Dr West Jordan, UT 84088
Cobble Creek NeighborhoodEstimated Value: $652,000 - $781,459
3
Beds
3
Baths
2,331
Sq Ft
$313/Sq Ft
Est. Value
About This Home
This home is located at 4738 W Baldy Dr, West Jordan, UT 84088 and is currently estimated at $729,365, approximately $312 per square foot. 4738 W Baldy Dr is a home with nearby schools including Hayden Peak Elementary School, West Hills Middle School, and Copper Hills High School.
Ownership History
Date
Name
Owned For
Owner Type
Purchase Details
Closed on
Jul 20, 2020
Sold by
Rustad Phillip and Rustad Kerri
Bought by
Rustad Phillip Walter and Rustad Kerri
Current Estimated Value
Home Financials for this Owner
Home Financials are based on the most recent Mortgage that was taken out on this home.
Original Mortgage
$258,285
Outstanding Balance
$229,455
Interest Rate
3.2%
Mortgage Type
VA
Estimated Equity
$499,910
Purchase Details
Closed on
Jul 28, 2011
Sold by
Williamsburg Holdings Company Llc
Bought by
Rustad Phillip and Rustad Kerri
Home Financials for this Owner
Home Financials are based on the most recent Mortgage that was taken out on this home.
Original Mortgage
$316,895
Interest Rate
4.46%
Mortgage Type
VA
Purchase Details
Closed on
Sep 28, 2009
Sold by
Land Solutions Lc
Bought by
Williamsburg Holdings Company Llc
Purchase Details
Closed on
Mar 25, 2005
Sold by
Glen R Pettit Inc
Bought by
Williamsburg Holdings Co Llc
Create a Home Valuation Report for This Property
The Home Valuation Report is an in-depth analysis detailing your home's value as well as a comparison with similar homes in the area
Home Values in the Area
Average Home Value in this Area
Purchase History
| Date | Buyer | Sale Price | Title Company |
|---|---|---|---|
| Rustad Phillip Walter | -- | Pinnacle Title Co | |
| Rustad Phillip | -- | Metro National Title | |
| Williamsburg Holdings Company Llc | -- | None Available | |
| Land Solutions Lc | -- | None Available | |
| Williamsburg Holdings Co Llc | -- | Merrill Title |
Source: Public Records
Mortgage History
| Date | Status | Borrower | Loan Amount |
|---|---|---|---|
| Open | Rustad Phillip Walter | $258,285 | |
| Closed | Rustad Phillip | $316,895 | |
| Closed | Williamsburg Holdings Co Llc | $0 |
Source: Public Records
Tax History Compared to Growth
Tax History
| Year | Tax Paid | Tax Assessment Tax Assessment Total Assessment is a certain percentage of the fair market value that is determined by local assessors to be the total taxable value of land and additions on the property. | Land | Improvement |
|---|---|---|---|---|
| 2025 | $3,939 | $763,800 | $178,800 | $585,000 |
| 2024 | $3,939 | $757,900 | $177,000 | $580,900 |
| 2023 | $3,965 | $719,000 | $167,000 | $552,000 |
| 2022 | $4,020 | $717,200 | $163,700 | $553,500 |
| 2021 | $3,418 | $555,000 | $127,200 | $427,800 |
| 2020 | $3,138 | $478,200 | $127,200 | $351,000 |
| 2019 | $3,074 | $459,400 | $120,100 | $339,300 |
| 2018 | $2,941 | $436,000 | $120,100 | $315,900 |
| 2017 | $2,807 | $414,300 | $120,100 | $294,200 |
| 2016 | $2,691 | $373,100 | $120,100 | $253,000 |
| 2015 | $2,593 | $350,600 | $126,900 | $223,700 |
| 2014 | $2,388 | $317,800 | $116,700 | $201,100 |
Source: Public Records
Map
Nearby Homes
- 4678 Emmons Dr
- 7973 S Nebo Dr
- 7908 Cold Stone Ln Unit N3
- 7903 Mckenzie Ln
- 7886 Mckenzie Ln
- 5189 W Dove Creek Ln
- 5183 W Swift Water Way
- 8359 Etude Dr
- 7882 S Dove Creek Ln Unit A6
- 7502 S Lace Wood Dr Unit 417
- 7518 Park Village Dr
- 7493 S Lace Wood Dr
- 5228 W Ranches Loop Rd
- 8322 Copper Vista Cir
- 5298 W Icehouse Way
- 7877 S 5440 W Unit 119
- 5422 W Island Creek Dr
- 7556 S Opal Mountain Way W Unit 311
- 7569 S Opal Mountain Way W Unit 308
- 7554 S Opal Mountain Way W Unit 310
- 4752 W Baldy Dr
- 4752 Baldy Dr
- 4726 Baldy Dr
- 4726 W Baldy Dr
- 4727 Baldy Dr
- 4743 W Baldy Dr
- 4743 Baldy Dr
- 4758 Hayden Peak Dr
- 4708 Baldy Dr
- 4708 W Baldy Dr
- 4764 Baldy Dr
- 4711 Baldy Dr
- 4711 W Baldy Dr
- 4759 Baldy Dr
- 7898 Goslin Ct
- 7918 Abercrombie Ln
- 4716 Emmons Dr
- 4704 W Emmons Dr
- 4704 Emmons Dr
- 7968 Baldy Dr