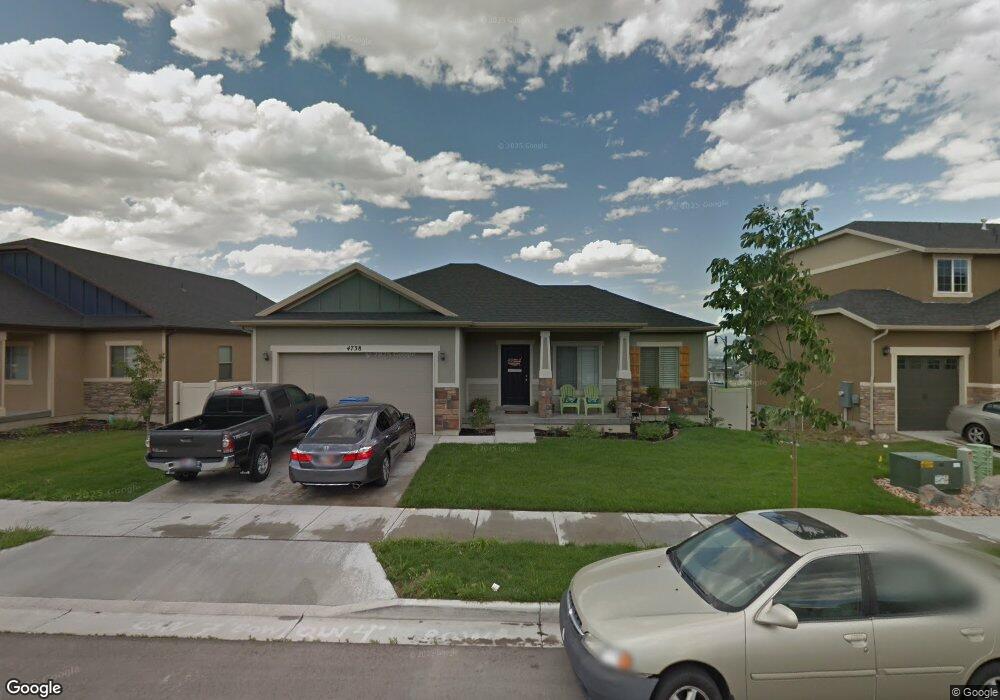
4738 W Cobblefield Dr Unit LOT 24 Herriman, UT 84096
Estimated Value: $561,000 - $648,000
3
Beds
2
Baths
2,920
Sq Ft
$210/Sq Ft
Est. Value
About This Home
This home is located at 4738 W Cobblefield Dr Unit LOT 24, Herriman, UT 84096 and is currently estimated at $611,872, approximately $209 per square foot. 4738 W Cobblefield Dr Unit LOT 24 is a home located in Salt Lake County with nearby schools including Foothills School, South Hills Middle School, and Mountain Ridge High School.
Ownership History
Date
Name
Owned For
Owner Type
Purchase Details
Closed on
Nov 2, 2020
Sold by
Stephens Bryan Hugh
Bought by
Stephens Bryan H and Stephens Julie A
Current Estimated Value
Home Financials for this Owner
Home Financials are based on the most recent Mortgage that was taken out on this home.
Original Mortgage
$223,500
Outstanding Balance
$199,240
Interest Rate
2.9%
Mortgage Type
New Conventional
Estimated Equity
$412,632
Purchase Details
Closed on
May 8, 2013
Sold by
Alpine Homes Llc
Bought by
Stephens Bryan H
Home Financials for this Owner
Home Financials are based on the most recent Mortgage that was taken out on this home.
Original Mortgage
$255,290
Interest Rate
3.25%
Mortgage Type
FHA
Purchase Details
Closed on
Oct 18, 2012
Sold by
Rosecrest Community Llc
Bought by
Alpine Homes Llc
Create a Home Valuation Report for This Property
The Home Valuation Report is an in-depth analysis detailing your home's value as well as a comparison with similar homes in the area
Home Values in the Area
Average Home Value in this Area
Purchase History
| Date | Buyer | Sale Price | Title Company |
|---|---|---|---|
| Stephens Bryan H | -- | Accommodation | |
| Stephens Bryan Hugh | -- | Paramount Title | |
| Stephens Bryan H | -- | First American Title Co | |
| Alpine Homes Llc | -- | Metro National Title |
Source: Public Records
Mortgage History
| Date | Status | Borrower | Loan Amount |
|---|---|---|---|
| Open | Stephens Bryan Hugh | $223,500 | |
| Closed | Stephens Bryan H | $255,290 |
Source: Public Records
Tax History Compared to Growth
Tax History
| Year | Tax Paid | Tax Assessment Tax Assessment Total Assessment is a certain percentage of the fair market value that is determined by local assessors to be the total taxable value of land and additions on the property. | Land | Improvement |
|---|---|---|---|---|
| 2025 | $3,480 | $578,000 | $158,400 | $419,600 |
| 2024 | $3,480 | $570,800 | $162,300 | $408,500 |
| 2023 | $3,480 | $556,800 | $159,100 | $397,700 |
| 2022 | $3,677 | $569,000 | $156,000 | $413,000 |
| 2021 | $2,983 | $405,300 | $129,700 | $275,600 |
| 2020 | $2,872 | $367,700 | $118,200 | $249,500 |
| 2019 | $2,786 | $350,800 | $93,600 | $257,200 |
| 2018 | $2,611 | $323,700 | $91,100 | $232,600 |
| 2017 | $2,471 | $302,900 | $91,100 | $211,800 |
| 2016 | $2,433 | $286,100 | $91,100 | $195,000 |
| 2015 | $2,382 | $271,500 | $96,600 | $174,900 |
| 2014 | $2,342 | $261,400 | $92,000 | $169,400 |
Source: Public Records
Map
Nearby Homes
- 4657 W Etonboro Dr
- 14427 S Attleboro Dr
- 4591 W Heritagefield Cir
- 4894 W Chrome Rd Unit 48
- 4966 W Rose Quartz
- 14649 S Quiet Glen Dr
- 14272 S Highfield Dr
- 4863 W River Chase Rd
- 14512 S Quiet Shade Dr
- 4472 W Lone Shadow Ln
- 14397 S Hill Shadow Way Unit 87
- 14558 S Quiet Shade Dr
- 5063 W Arete Way
- 4411 W Meadow Path Ln
- 14313 S Meadow Rose Dr
- 14908 S Fawley Ln
- 4472 W Birkdale Dr
- 14357 S Sherwell Ct
- 14762 S Desert Sage Dr
- 5102 W Valmont Way
- 4748 W Cobblefield Dr
- 4732 W Cobblefield Dr
- 4722 W Cobblefield Dr
- 4762 W Cobblefield Dr Unit LT 022
- 14539 S Beaconsfield Cir
- 4737 W Cobblefield Dr Unit 80
- 4737 W Cobblefield Dr
- 4729 W Cobblefield Dr Unit 79
- 4729 W Cobblefield Dr
- 4729 W Highfield Cir
- 4766 W Cobblefield Dr Unit LOT 21
- 4766 W Cobblefield Dr
- 4712 W Cobblefield Dr
- 4719 W Cobblefield Dr Unit 78
- 4719 W Cobblefield Dr
- 4717 W Highfield Cir Unit X91
- 4717 W Highfield Cir
- 14559 S Beaconsfield Cir
- 14536 S Beaconsfield Cir
- 4739 W Highfield Cir Unit X92