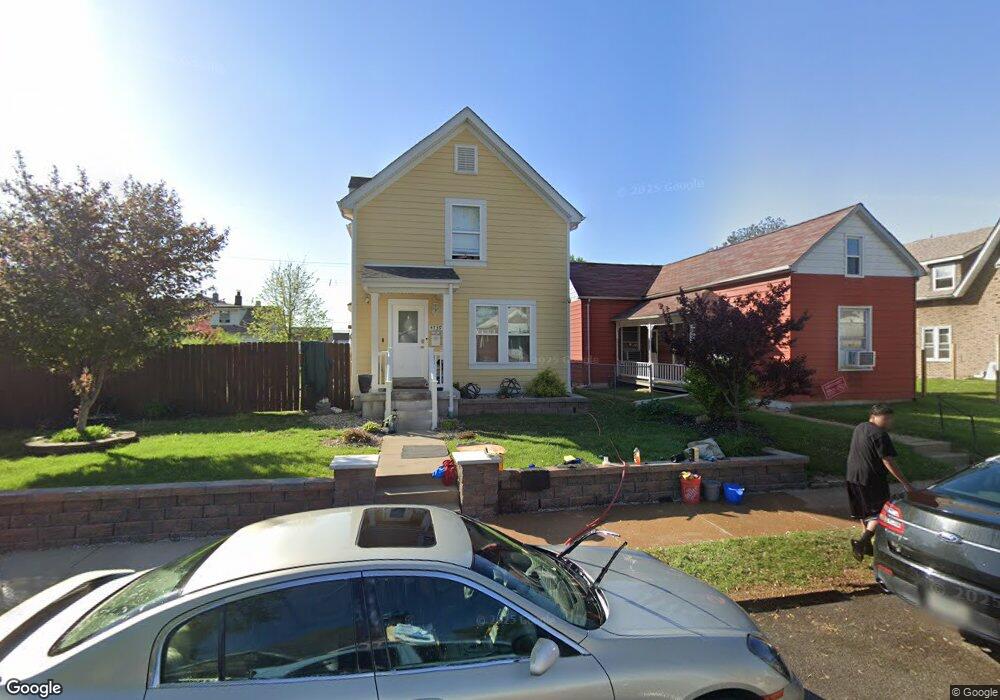
4739 Adkins Ave Saint Louis, MO 63116
Bevo Mill NeighborhoodEstimated Value: $203,000 - $226,000
--
Bed
--
Bath
1,440
Sq Ft
$149/Sq Ft
Est. Value
About This Home
This home is located at 4739 Adkins Ave, Saint Louis, MO 63116 and is currently estimated at $214,551, approximately $148 per square foot. 4739 Adkins Ave is a home located in St. Louis City with nearby schools including Oak Hill Elementary School, Long International Middle School, and Roosevelt High School.
Ownership History
Date
Name
Owned For
Owner Type
Purchase Details
Closed on
Jun 15, 2015
Sold by
Allman Builders Llc
Bought by
Valencia Johanna
Current Estimated Value
Home Financials for this Owner
Home Financials are based on the most recent Mortgage that was taken out on this home.
Original Mortgage
$112,917
Outstanding Balance
$87,301
Interest Rate
3.7%
Mortgage Type
FHA
Estimated Equity
$127,250
Purchase Details
Closed on
Jun 5, 2014
Sold by
Land Reutilization Authority Of The City
Bought by
Allman Builders Llc
Purchase Details
Closed on
Dec 30, 2010
Sold by
Lanow Partnership Llc
Bought by
Land Reutilization Authority Of The City
Purchase Details
Closed on
Sep 8, 2006
Sold by
Nester Gerard A
Bought by
Lanow Partnership Llc
Purchase Details
Closed on
Dec 19, 1997
Sold by
Land Reutilization Authority Of The City
Bought by
Schneider William M and Gerau Rose Marie
Create a Home Valuation Report for This Property
The Home Valuation Report is an in-depth analysis detailing your home's value as well as a comparison with similar homes in the area
Home Values in the Area
Average Home Value in this Area
Purchase History
| Date | Buyer | Sale Price | Title Company |
|---|---|---|---|
| Valencia Johanna | -- | Sec | |
| Allman Builders Llc | -- | Stl | |
| Land Reutilization Authority Of The City | -- | None Available | |
| Lanow Partnership Llc | -- | Abstar Title Company | |
| Schneider William M | $135 | -- |
Source: Public Records
Mortgage History
| Date | Status | Borrower | Loan Amount |
|---|---|---|---|
| Open | Valencia Johanna | $112,917 |
Source: Public Records
Tax History Compared to Growth
Tax History
| Year | Tax Paid | Tax Assessment Tax Assessment Total Assessment is a certain percentage of the fair market value that is determined by local assessors to be the total taxable value of land and additions on the property. | Land | Improvement |
|---|---|---|---|---|
| 2025 | $3,042 | $41,760 | $2,150 | $39,610 |
| 2024 | $2,894 | $36,010 | $2,150 | $33,860 |
| 2023 | $2,894 | $36,010 | $2,150 | $33,860 |
| 2022 | $2,705 | $32,380 | $2,150 | $30,230 |
| 2021 | $2,701 | $32,380 | $2,150 | $30,230 |
| 2020 | $2,357 | $28,440 | $2,150 | $26,290 |
| 2019 | $2,349 | $28,450 | $2,150 | $26,300 |
| 2018 | $1,946 | $22,780 | $2,150 | $20,630 |
| 2017 | $1,913 | $22,780 | $2,150 | $20,630 |
| 2016 | $2,790 | $32,950 | $2,150 | $30,800 |
| 2015 | $191 | $32,950 | $2,150 | $30,800 |
| 2014 | -- | $4,940 | $2,150 | $2,790 |
Source: Public Records
Map
Nearby Homes
- 4639 Adkins Ave
- 4707 Ray Ave
- 4201 Walsh St
- 4177 Walsh St
- 4163 Walsh St
- 4109 Walsh St
- 4171 Eichelberger St
- 4045 Walsh St
- 4552 Ray Ave
- 4631 Morganford Rd
- 4530 Newport Ave
- 4525 Varrelmann Ave
- 4219 Ellenwood Ave
- 5231 Steffens Ave
- 4063 Taft Ave
- 4000 Steffens Ave
- 4333 Neosho St
- 3939 Itaska St
- 4343 Neosho St
- 4028 Schiller Place
- 4735 Adkins Ave
- 4741 Adkins Ave
- 4745 Adkins Ave
- 4747 Adkins Ave
- 4221 Delor St
- 4225 Delor St
- 4725 Adkins Ave
- 4732 Varrelmann Ave
- 4229 Delor St
- 4723 Adkins Ave
- 4728 Varrelmann Ave
- 4736 Adkins Ave
- 4740 Adkins Ave
- 4734 Adkins Ave
- 4726 Varrelmann Ave
- 4742 Adkins Ave
- 4730 Adkins Ave
- 4721 Adkins Ave
- 4746 Adkins Ave
- 4728 Adkins Ave