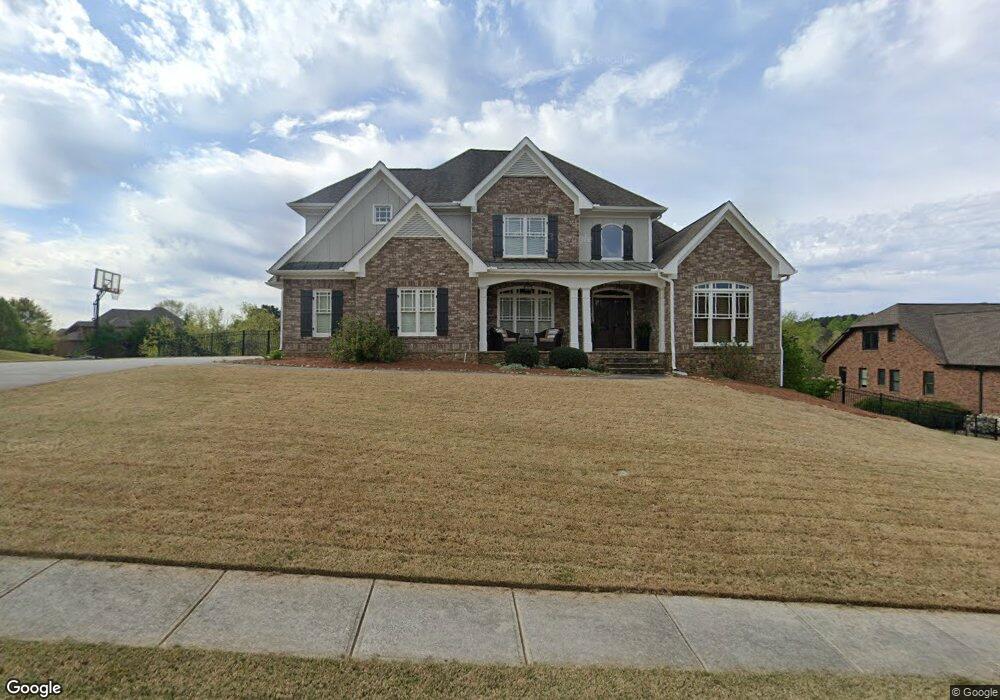
4739 Cardinal Ridge Way Unit Lot 143 Flowery Branch, GA 30542
Estimated Value: $685,000 - $929,000
4
Beds
4
Baths
2,852
Sq Ft
$294/Sq Ft
Est. Value
About This Home
This home is located at 4739 Cardinal Ridge Way Unit Lot 143, Flowery Branch, GA 30542 and is currently estimated at $839,553, approximately $294 per square foot. 4739 Cardinal Ridge Way Unit Lot 143 is a home located in Hall County with nearby schools including Martin Elementary School, Southwest Middle School, and C.W. Davis Middle School.
Ownership History
Date
Name
Owned For
Owner Type
Purchase Details
Closed on
Sep 29, 2011
Sold by
Ga Grandview
Bought by
Edwards Adam K and Edwards Amy O
Current Estimated Value
Home Financials for this Owner
Home Financials are based on the most recent Mortgage that was taken out on this home.
Original Mortgage
$267,650
Outstanding Balance
$174,904
Interest Rate
3.25%
Mortgage Type
FHA
Estimated Equity
$664,649
Purchase Details
Closed on
Jan 4, 2011
Sold by
J S Builders Llc
Bought by
Res-Ga Grandview Llc
Purchase Details
Closed on
Aug 18, 2006
Sold by
Bainbridge Homes Llc
Bought by
J S Builders Llc
Home Financials for this Owner
Home Financials are based on the most recent Mortgage that was taken out on this home.
Original Mortgage
$1,325,275
Interest Rate
6.71%
Purchase Details
Closed on
Dec 1, 2005
Sold by
Ruby-Forrest Ltd
Bought by
Bainbridge Homes Llc
Create a Home Valuation Report for This Property
The Home Valuation Report is an in-depth analysis detailing your home's value as well as a comparison with similar homes in the area
Home Values in the Area
Average Home Value in this Area
Purchase History
| Date | Buyer | Sale Price | Title Company |
|---|---|---|---|
| Edwards Adam K | $320,000 | -- | |
| Res-Ga Grandview Llc | $792,000 | -- | |
| J S Builders Llc | $445,000 | -- | |
| Bainbridge Homes Llc | $1,193,900 | -- |
Source: Public Records
Mortgage History
| Date | Status | Borrower | Loan Amount |
|---|---|---|---|
| Open | Edwards Adam K | $267,650 | |
| Previous Owner | J S Builders Llc | $1,325,275 |
Source: Public Records
Tax History Compared to Growth
Tax History
| Year | Tax Paid | Tax Assessment Tax Assessment Total Assessment is a certain percentage of the fair market value that is determined by local assessors to be the total taxable value of land and additions on the property. | Land | Improvement |
|---|---|---|---|---|
| 2024 | $7,809 | $308,880 | $72,480 | $236,400 |
| 2023 | $6,920 | $261,520 | $51,640 | $209,880 |
| 2022 | $5,932 | $223,280 | $45,760 | $177,520 |
| 2021 | $5,277 | $194,080 | $32,120 | $161,960 |
| 2020 | $5,229 | $186,720 | $23,040 | $163,680 |
| 2019 | $5,047 | $178,440 | $23,040 | $155,400 |
| 2018 | $5,106 | $175,320 | $28,000 | $147,320 |
| 2017 | $4,112 | $168,520 | $28,000 | $140,520 |
| 2016 | $4,015 | $141,600 | $1,080 | $140,520 |
| 2015 | $3,837 | $166,560 | $20,000 | $146,560 |
| 2014 | $3,837 | $134,080 | $11,680 | $122,400 |
Source: Public Records
Map
Nearby Homes
- 4860 Grandview Ct
- 4864 Grandview Ct
- 5059 Lancashire Ct
- 4711 Grandview Pkwy
- 4723 Grandview Pkwy
- 4826 Rose Heights Dr
- 5021 Limerick Ln
- 4947 Cash Rd
- 4626 Deer Creek Ct
- 4647 Laurel Brook Dr
- 4580 J M Turk Rd
- 4827 Daintree Ct
- 4621 Stanley Rd
- 4695 Eucalyptus Way
- 4860 Wildlife Way
- 7344 Rocklin Ln
- 5619 Chickory Dr Unit 126
- 4739 Cardinal Ridge Way
- 4745 Cardinal Ridge Way
- 4735 Cardinal Ridge Way
- 0 Cardinal Ridge Way Unit 8658736
- 0 Cardinal Ridge Way Unit 8646743
- 0 Cardinal Ridge Way Unit 8615226
- 0 Cardinal Ridge Way Unit 8561090
- 0 Cardinal Ridge Way Unit 3272351
- 0 Cardinal Ridge Way Unit 8515240
- 0 Cardinal Ridge Way Unit 8341510
- 0 Cardinal Ridge Way Unit 8493139
- 0 Cardinal Ridge Way Unit 3130277
- 0 Cardinal Ridge Way Unit 3272343
- 0 Cardinal Ridge Way Unit 7236179
- 0 Cardinal Ridge Way Unit 7266719
- 0 Cardinal Ridge Way Unit 7452379
- 0 Cardinal Ridge Way Unit 7455832
- 0 Cardinal Ridge Way Unit 8155147
- 0 Cardinal Ridge Way Unit 8164634
- 0 Cardinal Ridge Way Unit 8186048