Estimated Value: $503,472
About This Home
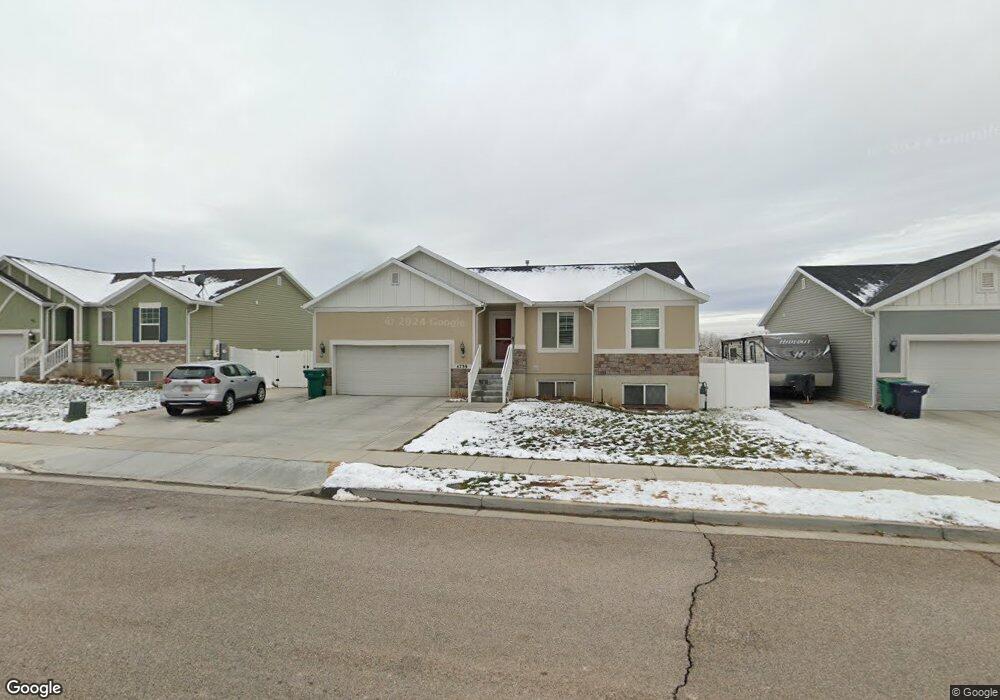
This home is located at 4739 S 2950 W, Roy, UT 84067 and is currently priced at $503,472, approximately $357 per square foot. 4739 S 2950 W is a home.
Ownership History
We collect this data history from publicly available records. To have your information removed, we recommend requesting removal directly through your county’s website.
Purchase Details
Purchase Details
Home Financials for this Owner
Home Financials are based on the most recent Mortgage that was taken out on this home.Home Values in the Area
Average Home Value in this Area
Purchase History
We collect this data history from publicly available records. To have your information removed, we recommend requesting removal directly through your county’s website.
| Date | Buyer | Sale Price | Title Company |
|---|---|---|---|
| -- | Us Title | ||
| -- | Aspen Title |
Mortgage History
We collect this data history from publicly available records. To have your information removed, we recommend requesting removal directly through your county’s website.
| Date | Status | Borrower | Loan Amount |
|---|---|---|---|
| Previous Owner | $99,060 |
Tax History
We collect this data history from publicly available records. To have your information removed, we recommend requesting removal directly through your county’s website.
| Year | Tax Paid | Tax Assessment Tax Assessment Total Assessment is a certain percentage of the fair market value that is determined by local assessors to be the total taxable value of land and additions on the property. | Land | Improvement |
|---|---|---|---|---|
| 2026 | $2,975 | $477,703 | $141,851 | $335,852 |
| 2025 | $2,975 | $478,073 | $141,851 | $336,222 |
| 2024 | $2,898 | $257,949 | $77,538 | $180,411 |
| 2023 | $2,616 | $231,550 | $71,558 | $159,992 |
| 2022 | $2,821 | $258,500 | $60,732 | $197,768 |
| 2021 | $2,324 | $350,000 | $85,494 | $264,506 |
| 2020 | $2,251 | $312,000 | $85,494 | $226,506 |
| 2019 | $2,155 | $281,000 | $59,687 | $221,313 |
| 2018 | $2,025 | $248,000 | $52,792 | $195,208 |
| 2017 | $1,540 | $171,902 | $52,792 | $119,110 |
| 2016 | $925 | $63,516 | $63,516 | $0 |
| 2015 | $611 | $43,237 | $43,237 | $0 |
| 2014 | -- | $0 | $0 | $0 |
Map
- 3057 W 4850 S
- 4931 S 2825 W
- 4953 S 3000 W
- 4848 S 3200 W
- 4995 S 3100 W
- 5079 S 2825 W
- 2898 W 4425 S
- 5007 S 2675 W
- 4385 S 2900 W
- 2590 W 5000 S
- 3334 W 4725 S
- 4046 S Sandridge Dr W Unit 3
- 2328 W Magnolia Ln Unit 102
- 4046 S Sandridge Dr W Unit 4
- 4853 S 4175 W
- 2328 W Magnolia Ln Unit 101
- 2788 W 4400 S
- 4371 S 2900 W
- 4679 S 2475 W
- 5197 S 3100 W
- 4757 S 2950 W
- 4745 S 2950 W Unit 50
- 4769 S 2950 W Unit 48
- 4769 S 2950 W
- 2998 W 4750 S
- 4783 S 2950 W
- 3007 W 4750 S
- 3006 W 4750 S
- 3006 W 4750 S Unit LOT 17
- 4756 S 2950 W
- 4766 S 2950 W
- 4744 S 2950 W
- 4727 S 2950 W Unit 52
- 4727 S 2950 W
- 2980 W 4800 S
- 4778 S 2950 W
- 4738 S 2950 W
- 3015 W 4750 S
- 2994 W 4800 S
- 3014 W 4750 S Unit LOT 16
Ask me questions while you tour the home.