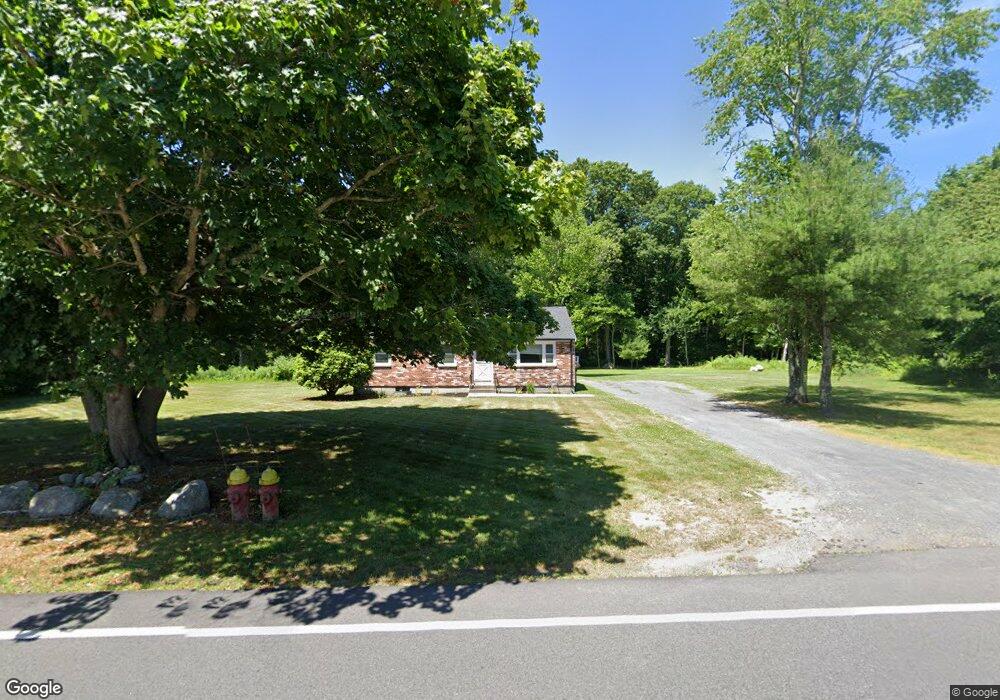
474 Cedar St East Bridgewater, MA 02333
Estimated Value: $487,734 - $508,000
3
Beds
1
Bath
960
Sq Ft
$520/Sq Ft
Est. Value
About This Home
This home is located at 474 Cedar St, East Bridgewater, MA 02333 and is currently estimated at $499,184, approximately $519 per square foot. 474 Cedar St is a home located in Plymouth County with nearby schools including Central Elementary School, Gordon W Mitchell Middle School, and East Bridgewater Jr./Sr. High School.
Ownership History
Date
Name
Owned For
Owner Type
Purchase Details
Closed on
Dec 17, 2014
Sold by
Kennedy William E Est
Bought by
Kennedy Patrick W
Current Estimated Value
Home Financials for this Owner
Home Financials are based on the most recent Mortgage that was taken out on this home.
Original Mortgage
$200,000
Outstanding Balance
$153,762
Interest Rate
4.02%
Mortgage Type
New Conventional
Estimated Equity
$345,422
Create a Home Valuation Report for This Property
The Home Valuation Report is an in-depth analysis detailing your home's value as well as a comparison with similar homes in the area
Home Values in the Area
Average Home Value in this Area
Purchase History
| Date | Buyer | Sale Price | Title Company |
|---|---|---|---|
| Kennedy Patrick W | $250,000 | -- |
Source: Public Records
Mortgage History
| Date | Status | Borrower | Loan Amount |
|---|---|---|---|
| Open | Kennedy Patrick W | $200,000 |
Source: Public Records
Tax History Compared to Growth
Tax History
| Year | Tax Paid | Tax Assessment Tax Assessment Total Assessment is a certain percentage of the fair market value that is determined by local assessors to be the total taxable value of land and additions on the property. | Land | Improvement |
|---|---|---|---|---|
| 2025 | $5,691 | $416,300 | $191,200 | $225,100 |
| 2024 | $5,543 | $400,500 | $183,900 | $216,600 |
| 2023 | $5,474 | $378,800 | $183,900 | $194,900 |
| 2022 | $5,444 | $349,000 | $167,300 | $181,700 |
| 2021 | $5,268 | $309,000 | $160,700 | $148,300 |
| 2020 | $5,139 | $297,200 | $154,600 | $142,600 |
| 2019 | $5,013 | $285,500 | $147,700 | $137,800 |
| 2018 | $4,727 | $263,200 | $147,700 | $115,500 |
| 2017 | $4,593 | $251,000 | $140,900 | $110,100 |
| 2016 | $4,480 | $246,700 | $140,900 | $105,800 |
| 2015 | $4,326 | $243,600 | $139,900 | $103,700 |
| 2014 | $4,150 | $238,900 | $136,900 | $102,000 |
Source: Public Records
Map
Nearby Homes
- 1247 Central St
- 9 Daisy Ln
- 170 Elm St
- 5 Della Way
- 844 Washington St
- 80 Phillips St
- 72 Phillips St
- 936 Central St
- 1 Simmons Place
- 1054 Main St
- 182 Crystal Water Dr Unit 182
- 217 Crystal Water Dr
- 28 Brookbend Way E
- 78 Crystal Water Dr
- 22 Hudson St
- 1993 Washington St
- 51 Stonegate Dr
- 14 Mountain Ash Rd
- 71 Stonegate Dr
- 587 Bridge St