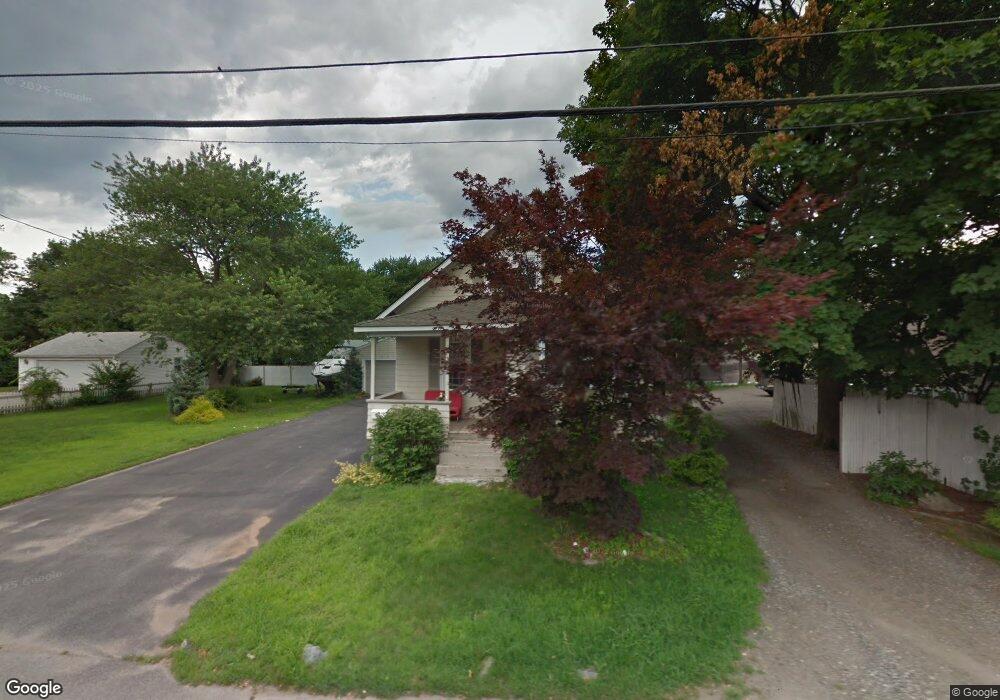
474 Chestnut St Warwick, RI 02888
Norwood NeighborhoodEstimated Value: $362,312 - $423,000
3
Beds
2
Baths
1,955
Sq Ft
$200/Sq Ft
Est. Value
About This Home
This home is located at 474 Chestnut St, Warwick, RI 02888 and is currently estimated at $391,578, approximately $200 per square foot. 474 Chestnut St is a home located in Kent County with nearby schools including Nel/Cps Construction Career, St. Peter School, and Saint Paul School.
Ownership History
Date
Name
Owned For
Owner Type
Purchase Details
Closed on
Feb 26, 2013
Sold by
Allaire David W and Pappas Sotirios M
Bought by
Route 1 Porperties Llc
Current Estimated Value
Home Financials for this Owner
Home Financials are based on the most recent Mortgage that was taken out on this home.
Original Mortgage
$370,000
Outstanding Balance
$254,639
Interest Rate
3.38%
Estimated Equity
$136,939
Purchase Details
Closed on
May 25, 2007
Sold by
Brown Linda S
Bought by
Pappas Sotirios M
Home Financials for this Owner
Home Financials are based on the most recent Mortgage that was taken out on this home.
Original Mortgage
$207,600
Interest Rate
6.27%
Mortgage Type
Purchase Money Mortgage
Purchase Details
Closed on
Mar 25, 2005
Sold by
Lemay Normand J and Lemay Deborah A
Bought by
Brown Linda S
Create a Home Valuation Report for This Property
The Home Valuation Report is an in-depth analysis detailing your home's value as well as a comparison with similar homes in the area
Home Values in the Area
Average Home Value in this Area
Purchase History
We collect this data history from publicly available records. To have your information removed, we recommend requesting removal directly through your county’s website.
| Date | Buyer | Sale Price | Title Company |
|---|---|---|---|
| Route 1 Porperties Llc | -- | -- | |
| Pappas Sotirios M | $259,500 | -- | |
| Brown Linda S | $254,000 | -- | |
| Route 1 Porperties Llc | -- | -- | |
| Pappas Sotirios M | $259,500 | -- | |
| Brown Linda S | $254,000 | -- |
Source: Public Records
Mortgage History
We collect this data history from publicly available records. To have your information removed, we recommend requesting removal directly through your county’s website.
| Date | Status | Borrower | Loan Amount |
|---|---|---|---|
| Open | Brown Linda S | $370,000 | |
| Previous Owner | Brown Linda S | $207,600 |
Source: Public Records
Tax History
| Year | Tax Paid | Tax Assessment Tax Assessment Total Assessment is a certain percentage of the fair market value that is determined by local assessors to be the total taxable value of land and additions on the property. | Land | Improvement |
|---|---|---|---|---|
| 2025 | $4,003 | $315,200 | $108,700 | $206,500 |
| 2024 | $3,681 | $254,400 | $94,500 | $159,900 |
| 2023 | $3,516 | $247,800 | $87,900 | $159,900 |
| 2022 | $3,319 | $177,200 | $56,900 | $120,300 |
| 2021 | $3,319 | $177,200 | $56,900 | $120,300 |
| 2020 | $3,319 | $177,200 | $56,900 | $120,300 |
| 2019 | $3,319 | $177,200 | $56,900 | $120,300 |
| 2018 | $2,900 | $139,400 | $56,900 | $82,500 |
| 2017 | $2,821 | $139,400 | $56,900 | $82,500 |
| 2016 | $2,821 | $139,400 | $56,900 | $82,500 |
| 2015 | $3,048 | $146,900 | $55,800 | $91,100 |
| 2014 | $2,947 | $146,900 | $55,800 | $91,100 |
| 2013 | $2,907 | $146,900 | $55,800 | $91,100 |
Source: Public Records
Map
Nearby Homes
- 365 Maple St
- 222 Pettaconsett Ave
- 376 Norwood Ave
- 1153 Post Rd
- 77 Majestic Ave
- 145 Massasoit Dr
- 33 Pilgrim Dr
- 68 Maryland Ave
- 77 Kentucky Ave
- 99 Potomac Rd
- 153 Falcon Ave
- 0 Elmwood Ave
- 87 Easton Ave
- 15 Christopher Rhodes Way
- 6 Christopher Rhodes Way
- 110 Pilgrim Pkwy Unit 11
- 79 Bellevue Ave
- 23 Astral St
- 78 Eddy St
- 200 Underwood Ave
Your Personal Tour Guide
Ask me questions while you tour the home.