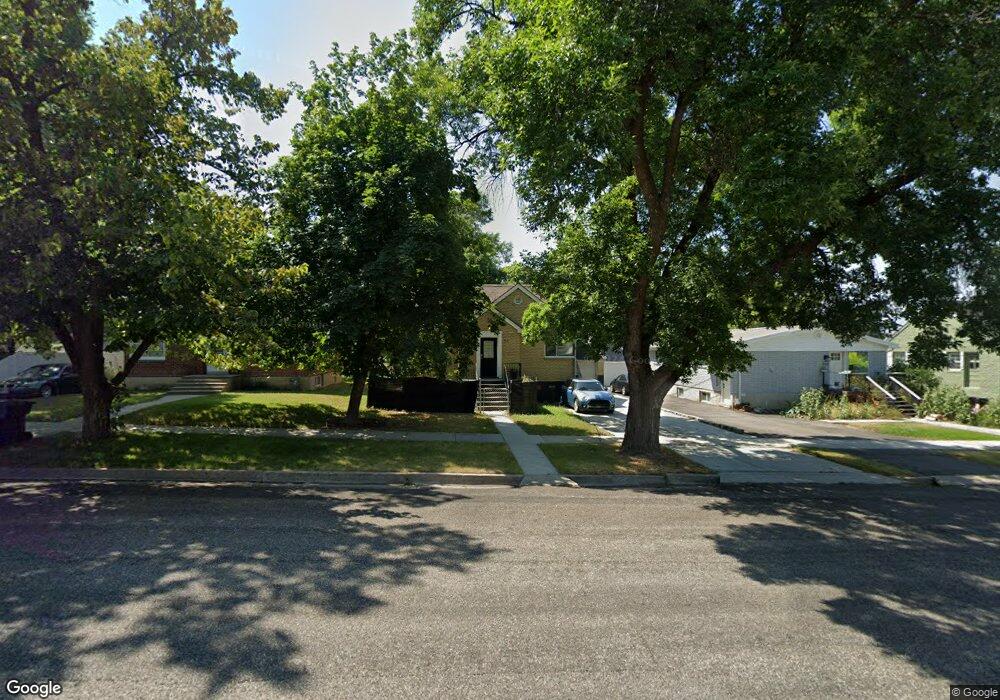
474 E 700 N Logan, UT 84321
Adams NeighborhoodEstimated Value: $341,755 - $421,000
5
Beds
2
Baths
1,520
Sq Ft
$247/Sq Ft
Est. Value
About This Home
This home is located at 474 E 700 N, Logan, UT 84321 and is currently estimated at $374,939, approximately $246 per square foot. 474 E 700 N is a home located in Cache County with nearby schools including Adams Elementary School, Mount Logan Middle School, and Logan High School.
Ownership History
Date
Name
Owned For
Owner Type
Purchase Details
Closed on
Jun 4, 2025
Sold by
Moyle Douglas J and Moyle Tamra M
Bought by
Douglas J Moyle And Tamra Moyle Family Trust and Moyle
Current Estimated Value
Purchase Details
Closed on
Jul 29, 2008
Sold by
Moyle Douglas J
Bought by
Moyle Douglas J and Moyle Tamra M
Purchase Details
Closed on
May 6, 2002
Sold by
Thompson Gerry Maxine Leak
Bought by
Dennehy Mark L and Dennehy Sheila A
Home Financials for this Owner
Home Financials are based on the most recent Mortgage that was taken out on this home.
Original Mortgage
$96,140
Interest Rate
7.13%
Mortgage Type
FHA
Purchase Details
Closed on
Apr 6, 2001
Sold by
Thompson Maxine L
Bought by
Thompson Gerry Maxine Leak
Create a Home Valuation Report for This Property
The Home Valuation Report is an in-depth analysis detailing your home's value as well as a comparison with similar homes in the area
Home Values in the Area
Average Home Value in this Area
Purchase History
| Date | Buyer | Sale Price | Title Company |
|---|---|---|---|
| Douglas J Moyle And Tamra Moyle Family Trust | -- | None Listed On Document | |
| Moyle Douglas J | -- | Cache Title Company | |
| Moyle Douglas J | -- | Cache Title Company | |
| Moyle Douglas J | -- | Cache Title Company | |
| Dennehy Mark L | -- | American Secure Title | |
| Thompson Gerry Maxine Leak | -- | -- |
Source: Public Records
Mortgage History
| Date | Status | Borrower | Loan Amount |
|---|---|---|---|
| Previous Owner | Dennehy Mark L | $96,140 |
Source: Public Records
Tax History
| Year | Tax Paid | Tax Assessment Tax Assessment Total Assessment is a certain percentage of the fair market value that is determined by local assessors to be the total taxable value of land and additions on the property. | Land | Improvement |
|---|---|---|---|---|
| 2025 | $147 | $189,835 | $0 | $0 |
| 2024 | $1,507 | $188,725 | $0 | $0 |
| 2023 | $1,586 | $189,405 | $0 | $0 |
| 2022 | $1,667 | $185,890 | $0 | $0 |
| 2021 | $1,357 | $233,690 | $50,000 | $183,690 |
| 2020 | $1,234 | $191,300 | $50,000 | $141,300 |
| 2019 | $1,290 | $191,300 | $50,000 | $141,300 |
| 2018 | $1,246 | $168,720 | $50,000 | $118,720 |
| 2017 | $1,198 | $85,800 | $0 | $0 |
| 2016 | $1,242 | $81,400 | $0 | $0 |
| 2015 | $1,180 | $81,400 | $0 | $0 |
| 2014 | $1,067 | $81,400 | $0 | $0 |
| 2013 | -- | $81,430 | $0 | $0 |
Source: Public Records
Map
Nearby Homes
Your Personal Tour Guide
Ask me questions while you tour the home.