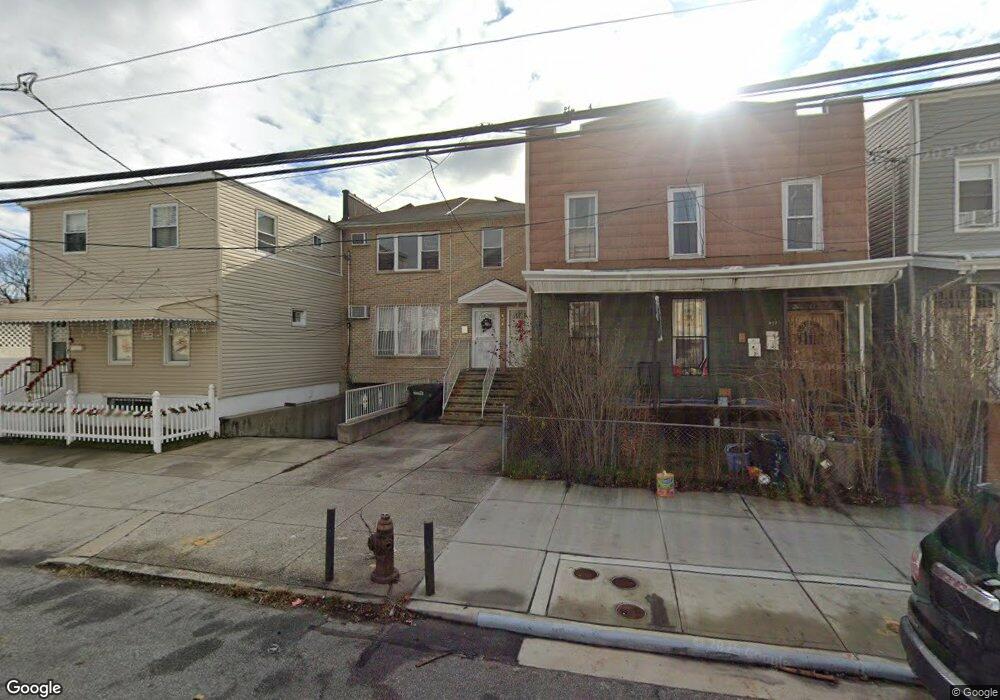
474 Glenmore Ave Unit Building Brooklyn, NY 11207
East New York NeighborhoodEstimated Value: $1,077,418 - $1,363,000
--
Bed
5
Baths
2,500
Sq Ft
$470/Sq Ft
Est. Value
About This Home
This home is located at 474 Glenmore Ave Unit Building, Brooklyn, NY 11207 and is currently estimated at $1,174,355, approximately $469 per square foot. 474 Glenmore Ave Unit Building is a home located in Kings County with nearby schools including P.S. 149 Danny Kaye, J.H.S 292 Margaret S. Douglas, and Salve Regina Catholic Academy.
Ownership History
Date
Name
Owned For
Owner Type
Purchase Details
Closed on
May 20, 2019
Sold by
Charles Beverly
Bought by
Dyer Nigel and Dyer Sadie
Current Estimated Value
Home Financials for this Owner
Home Financials are based on the most recent Mortgage that was taken out on this home.
Original Mortgage
$813,758
Outstanding Balance
$712,512
Interest Rate
4.1%
Mortgage Type
Purchase Money Mortgage
Estimated Equity
$461,843
Purchase Details
Closed on
Nov 24, 2004
Sold by
474 Corp
Bought by
Charles Beverly
Home Financials for this Owner
Home Financials are based on the most recent Mortgage that was taken out on this home.
Original Mortgage
$381,600
Interest Rate
5.63%
Mortgage Type
Purchase Money Mortgage
Purchase Details
Closed on
Jan 23, 2004
Sold by
Abn Development Corp
Bought by
474 Corp
Purchase Details
Closed on
Dec 12, 2003
Sold by
Obetoh Patricia
Bought by
Abn Development Corp
Create a Home Valuation Report for This Property
The Home Valuation Report is an in-depth analysis detailing your home's value as well as a comparison with similar homes in the area
Home Values in the Area
Average Home Value in this Area
Purchase History
| Date | Buyer | Sale Price | Title Company |
|---|---|---|---|
| Dyer Nigel | $820,000 | -- | |
| Dyer Nigel | $820,000 | -- | |
| Charles Beverly | $477,000 | -- | |
| Charles Beverly | $477,000 | -- | |
| 474 Corp | -- | -- | |
| 474 Corp | -- | -- | |
| Abn Development Corp | $20,000 | -- | |
| Abn Development Corp | $20,000 | -- |
Source: Public Records
Mortgage History
| Date | Status | Borrower | Loan Amount |
|---|---|---|---|
| Open | Dyer Nigel | $813,758 | |
| Closed | Dyer Nigel | $813,758 | |
| Previous Owner | Charles Beverly | $95,400 | |
| Previous Owner | Charles Beverly | $381,600 |
Source: Public Records
Tax History Compared to Growth
Tax History
| Year | Tax Paid | Tax Assessment Tax Assessment Total Assessment is a certain percentage of the fair market value that is determined by local assessors to be the total taxable value of land and additions on the property. | Land | Improvement |
|---|---|---|---|---|
| 2025 | $8,030 | $57,780 | $12,900 | $44,880 |
| 2024 | $8,030 | $53,460 | $12,900 | $40,560 |
| 2023 | $8,120 | $56,700 | $12,900 | $43,800 |
| 2022 | $7,921 | $56,580 | $12,900 | $43,680 |
| 2021 | $5,528 | $51,540 | $12,900 | $38,640 |
| 2020 | $2,520 | $34,260 | $12,900 | $21,360 |
| 2019 | $4,620 | $34,260 | $12,900 | $21,360 |
| 2018 | $6,792 | $33,318 | $9,376 | $23,942 |
| 2017 | $6,740 | $33,066 | $10,363 | $22,703 |
| 2016 | $6,236 | $31,195 | $11,234 | $19,961 |
| 2015 | $2,458 | $29,430 | $10,283 | $19,147 |
| 2014 | $2,458 | $27,765 | $8,252 | $19,513 |
Source: Public Records
Map
Nearby Homes
- 243 Wyona St
- 459 Belmont Ave
- 2210 Pitkin Ave
- 207 Bradford St
- 34&36 Marginal St
- 279 van Siclen Ave
- 342 Wyona St
- 159 Wyona St
- 297 Pennsylvania Ave
- 346 van Siclen Ave
- 358 van Siclen Ave
- 667 Sutter Ave
- 412 Hendrix St
- 663 Sutter Ave
- 317 Pennsylvania Ave
- 572 Glenmore Ave
- 303 Hendrix St
- 440 Miller Ave
- 576 Glenmore Ave
- 174 van Siclen Ave
- 474 Glenmore Ave
- 478 Glenmore Ave
- 472 Glenmore Ave
- 468 Glenmore Ave
- 480 Glenmore Ave
- 240 Bradford St
- 484 Glenmore Ave
- 229 Wyona St
- 464 Glenmore Ave
- 233 Wyona St Unit 2nd Fl
- 233 Wyona St
- 246 Bradford St
- 241 Wyona St
- 250 Bradford St
- 226 Bradford St
- 465 Glenmore Ave
- 486 Glenmore Ave
- 475 Glenmore Ave
- 252 Bradford St
- 463 Glenmore Ave