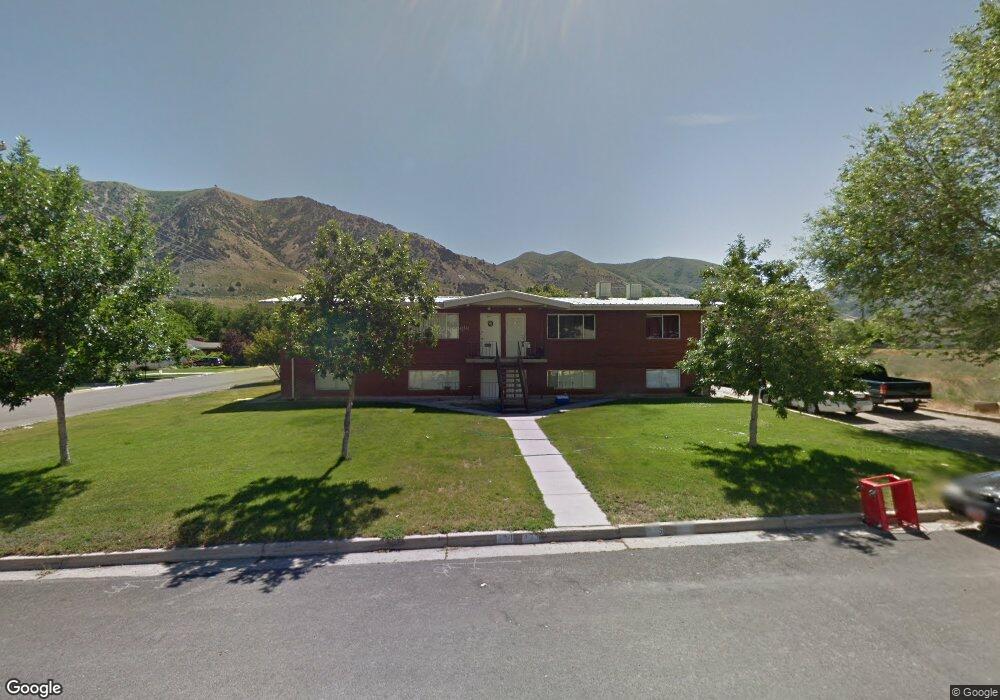
474 N 100 E Brigham City, UT 84302
Estimated Value: $500,316 - $564,000
Studio
--
Bath
1,986
Sq Ft
$264/Sq Ft
Est. Value
About This Home
This home is located at 474 N 100 E, Brigham City, UT 84302 and is currently estimated at $525,079, approximately $264 per square foot. 474 N 100 E is a home with nearby schools including Golden Spike Elementary, Box Elder Middle School, and Adele C. Young Intermediate School.
Ownership History
Date
Name
Owned For
Owner Type
Purchase Details
Closed on
Jul 1, 2014
Sold by
Price Dan R
Bought by
Price Dan R and Price Lesa L
Current Estimated Value
Home Financials for this Owner
Home Financials are based on the most recent Mortgage that was taken out on this home.
Original Mortgage
$168,750
Outstanding Balance
$53,410
Interest Rate
4.1%
Mortgage Type
Commercial
Estimated Equity
$471,669
Purchase Details
Closed on
Jun 30, 2014
Sold by
Bywater Gary
Bought by
Price Dan R
Home Financials for this Owner
Home Financials are based on the most recent Mortgage that was taken out on this home.
Original Mortgage
$168,750
Outstanding Balance
$53,410
Interest Rate
4.1%
Mortgage Type
Commercial
Estimated Equity
$471,669
Purchase Details
Closed on
Feb 19, 2014
Sold by
Hansen Tamara and Atwood Robert D
Bought by
Bywater Gary and The Bywater Family Living Trust
Create a Home Valuation Report for This Property
The Home Valuation Report is an in-depth analysis detailing your home's value as well as a comparison with similar homes in the area
Purchase History
| Date | Buyer | Sale Price | Title Company |
|---|---|---|---|
| Price Dan R | -- | Phillips Hansen Land Title C | |
| Price Dan R | -- | Phillips Hansen Land Title C | |
| Bywater Gary | -- | Phillips Hansen Land Title C |
Source: Public Records
Mortgage History
| Date | Status | Borrower | Loan Amount |
|---|---|---|---|
| Open | Price Dan R | $168,750 |
Source: Public Records
Tax History
| Year | Tax Paid | Tax Assessment Tax Assessment Total Assessment is a certain percentage of the fair market value that is determined by local assessors to be the total taxable value of land and additions on the property. | Land | Improvement |
|---|---|---|---|---|
| 2025 | $3,174 | $545,750 | $57,499 | $488,251 |
| 2024 | $2,835 | $600,000 | $57,499 | $542,501 |
| 2023 | $3,044 | $600,000 | $57,499 | $542,501 |
| 2022 | $1,981 | $363,000 | $40,000 | $323,000 |
| 2021 | $2,175 | $264,000 | $40,000 | $224,000 |
| 2020 | $1,625 | $264,000 | $40,000 | $224,000 |
| 2019 | $1,680 | $145,200 | $22,000 | $123,200 |
| 2018 | $1,689 | $145,200 | $145,200 | $0 |
| 2017 | $1,180 | $175,560 | $96,558 | $0 |
| 2016 | $1,283 | $96,558 | $8,800 | $87,758 |
| 2015 | $1,332 | $96,558 | $8,800 | $87,758 |
| 2014 | $1,332 | $96,558 | $8,800 | $87,758 |
| 2013 | -- | $96,558 | $8,800 | $87,758 |
Source: Public Records
Map
Nearby Homes
- 410 N Main St Unit 15
- 408 N 200 E
- 621 N 300 E
- 507 N 200 W
- 225 N Main St
- 682 N 300 W
- 508 N 400 W
- 287 W 750 N
- 736 Sunset Dr
- 734 Fairview Dr
- 801 Medoland Dr
- 607 Holiday Dr
- 976 N 200 W Unit V333
- 988 N 200 W Unit V336
- 965 N 200 W Unit U330
- 968 N 200 W Unit V331
- 972 N 200 W Unit V332
- 255 N 500 W
- 105 N 300 W
- 81 W 925 N
Your Personal Tour Guide
Ask me questions while you tour the home.