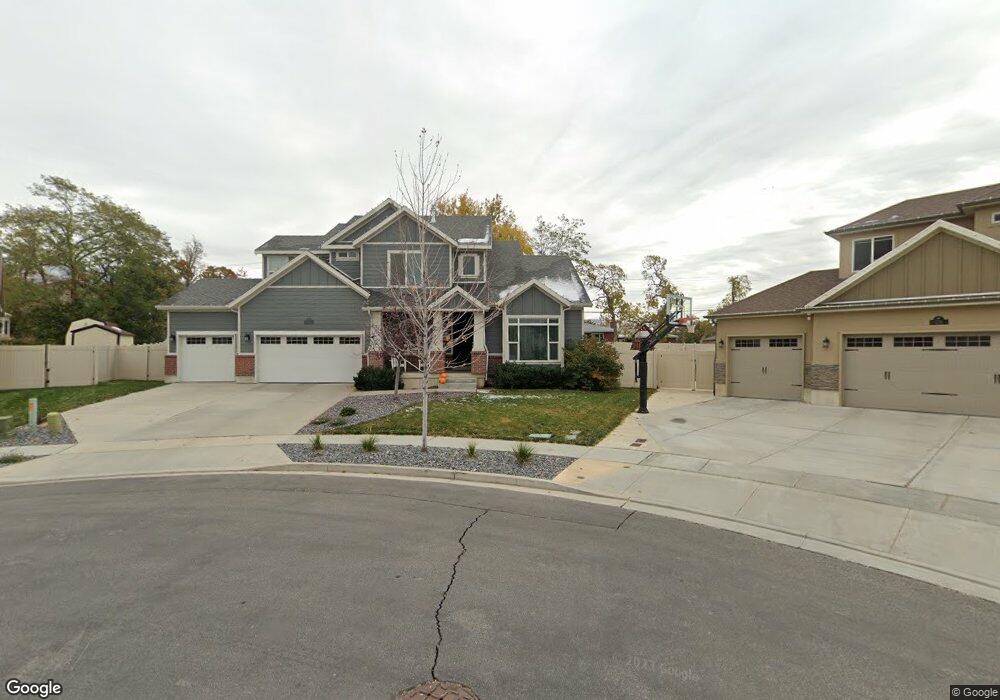
474 N Stone Creek Cir Bountiful, UT 84010
Estimated Value: $814,000 - $922,000
5
Beds
4
Baths
2,543
Sq Ft
$339/Sq Ft
Est. Value
About This Home
This home is located at 474 N Stone Creek Cir, Bountiful, UT 84010 and is currently estimated at $861,117, approximately $338 per square foot. 474 N Stone Creek Cir is a home with nearby schools including Tolman School, Bountiful Junior High School, and Bountiful High School.
Ownership History
Date
Name
Owned For
Owner Type
Purchase Details
Closed on
Jan 9, 2014
Sold by
Henry Walker Construction Of Northern Ut
Bought by
Phillips Amberlie and Muranaka Aaron M
Current Estimated Value
Home Financials for this Owner
Home Financials are based on the most recent Mortgage that was taken out on this home.
Original Mortgage
$401,580
Outstanding Balance
$300,744
Interest Rate
4.26%
Mortgage Type
New Conventional
Estimated Equity
$560,373
Purchase Details
Closed on
Jan 8, 2014
Sold by
G M W Development Inc
Bought by
Henry Walker Construction Of Northern Ut
Home Financials for this Owner
Home Financials are based on the most recent Mortgage that was taken out on this home.
Original Mortgage
$401,580
Outstanding Balance
$300,744
Interest Rate
4.26%
Mortgage Type
New Conventional
Estimated Equity
$560,373
Purchase Details
Closed on
Aug 30, 2013
Sold by
Gmw Development Inc
Bought by
South Davis Sewer District
Create a Home Valuation Report for This Property
The Home Valuation Report is an in-depth analysis detailing your home's value as well as a comparison with similar homes in the area
Purchase History
| Date | Buyer | Sale Price | Title Company |
|---|---|---|---|
| Phillips Amberlie | -- | Cottonwood Title Ins | |
| Henry Walker Construction Of Northern Ut | -- | Cottonwood Title Ins A | |
| South Davis Sewer District | -- | None Available |
Source: Public Records
Mortgage History
| Date | Status | Borrower | Loan Amount |
|---|---|---|---|
| Open | Phillips Amberlie | $401,580 | |
| Closed | Henry Walker Construction Of Northern Ut | $401,580 |
Source: Public Records
Tax History
| Year | Tax Paid | Tax Assessment Tax Assessment Total Assessment is a certain percentage of the fair market value that is determined by local assessors to be the total taxable value of land and additions on the property. | Land | Improvement |
|---|---|---|---|---|
| 2025 | $4,843 | $451,550 | $146,326 | $305,224 |
| 2024 | $4,599 | $441,650 | $134,822 | $306,828 |
| 2023 | $4,616 | $805,000 | $245,643 | $559,357 |
| 2022 | $4,887 | $468,050 | $130,968 | $337,082 |
| 2021 | $3,777 | $550,000 | $194,758 | $355,242 |
| 2020 | $3,311 | $484,000 | $177,311 | $306,689 |
| 2019 | $3,784 | $544,000 | $172,033 | $371,967 |
| 2018 | $3,812 | $542,000 | $160,164 | $381,836 |
| 2016 | $3,409 | $262,901 | $52,212 | $210,689 |
| 2015 | $2,820 | $203,611 | $52,212 | $151,399 |
| 2014 | $1,799 | $125,692 | $52,212 | $73,480 |
Source: Public Records
Map
Nearby Homes
- 345 N 400 E
- 453 N 400 E Unit 7-D
- 683 E 100 N
- 662 E 1200 N
- 1023 E 800 N
- 49 E 200 N Unit 4
- 41 E 200 N Unit 6
- 55 E 200 N Unit 2
- 975 E 1050 N
- 51 E 200 N Unit 3
- 256 N Main St
- 254 N Main St
- 252 N Main St
- 1105 E 600 N
- 908 Northern Hills Dr Unit 3
- 255 E 400 S
- 106 W 700 N
- 933 Northern Hills Cir
- 357 S 100 E
- 1420 N Main St
Your Personal Tour Guide
Ask me questions while you tour the home.