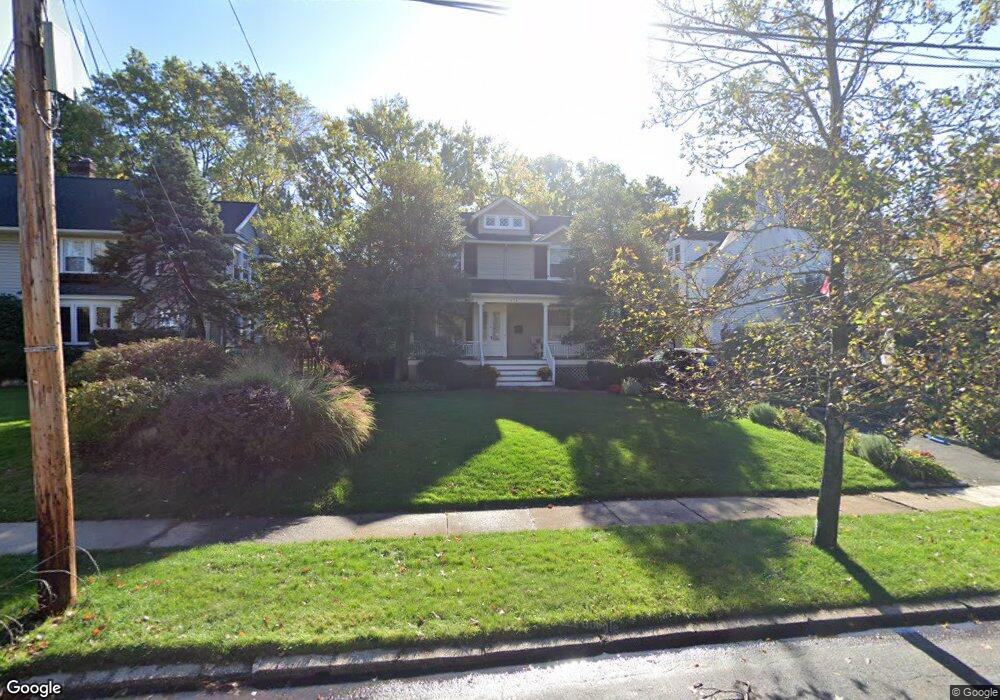
474 Richmond Ave Maplewood, NJ 07040
Estimated Value: $885,294 - $1,108,000
--
Bed
--
Bath
1,620
Sq Ft
$627/Sq Ft
Est. Value
About This Home
This home is located at 474 Richmond Ave, Maplewood, NJ 07040 and is currently estimated at $1,016,074, approximately $627 per square foot. 474 Richmond Ave is a home located in Essex County with nearby schools including Clinton Elementary School, South Orange Middle School, and Columbia Senior High School.
Ownership History
Date
Name
Owned For
Owner Type
Purchase Details
Closed on
Feb 10, 2003
Sold by
Reilly Susan Brittono
Bought by
Doherty Michael J and Gluck Amy
Current Estimated Value
Home Financials for this Owner
Home Financials are based on the most recent Mortgage that was taken out on this home.
Original Mortgage
$280,200
Interest Rate
5.84%
Purchase Details
Closed on
Jan 14, 1998
Sold by
Mele Gary
Bought by
O'Reilly Philip and O'Reilly Susan
Home Financials for this Owner
Home Financials are based on the most recent Mortgage that was taken out on this home.
Original Mortgage
$156,000
Interest Rate
7.11%
Purchase Details
Closed on
Jun 27, 1991
Sold by
Malinchak David J and Malinchak Caryl F
Bought by
Mele Gary and Mele Linda
Purchase Details
Closed on
Feb 3, 1989
Sold by
Kay Ceceil
Bought by
Malinchak David J and Malinchak Cheryl F
Create a Home Valuation Report for This Property
The Home Valuation Report is an in-depth analysis detailing your home's value as well as a comparison with similar homes in the area
Home Values in the Area
Average Home Value in this Area
Purchase History
| Date | Buyer | Sale Price | Title Company |
|---|---|---|---|
| Doherty Michael J | $362,900 | -- | |
| O'Reilly Philip | $195,000 | -- | |
| Mele Gary | $205,100 | -- | |
| Malinchak David J | $195,000 | -- |
Source: Public Records
Mortgage History
| Date | Status | Borrower | Loan Amount |
|---|---|---|---|
| Previous Owner | Doherty Michael J | $280,200 | |
| Previous Owner | O'Reilly Philip | $156,000 |
Source: Public Records
Tax History Compared to Growth
Tax History
| Year | Tax Paid | Tax Assessment Tax Assessment Total Assessment is a certain percentage of the fair market value that is determined by local assessors to be the total taxable value of land and additions on the property. | Land | Improvement |
|---|---|---|---|---|
| 2025 | $17,194 | $795,500 | $427,300 | $368,200 |
| 2024 | $17,194 | $795,500 | $427,300 | $368,200 |
| 2022 | $16,766 | $475,500 | $282,000 | $193,500 |
| 2021 | $16,257 | $475,500 | $282,000 | $193,500 |
| 2020 | $15,796 | $475,500 | $282,000 | $193,500 |
| 2019 | $15,340 | $475,500 | $282,000 | $193,500 |
| 2018 | $14,945 | $475,500 | $282,000 | $193,500 |
| 2017 | $14,498 | $475,500 | $282,000 | $193,500 |
| 2016 | $15,212 | $412,800 | $249,500 | $163,300 |
| 2015 | $14,861 | $412,800 | $249,500 | $163,300 |
| 2014 | $14,547 | $412,800 | $249,500 | $163,300 |
Source: Public Records
Map
Nearby Homes
- 7 Suffolk Ave
- 18 Burroughs Way
- 448 Prospect St
- 34 Lancaster Ave
- 34 Highland Ave
- 132 Garfield Place
- 163 Garfield Place
- 45 Essex Ave
- 168 Parker Ave
- 266 Waverly Place
- 98 Midland Blvd
- 101 Midland Blvd
- 25 Wetmore Ave
- 22 Lindsley Ave
- 15 Madison Ave
- 209 Montague Place
- 372 Valley St Unit G2
- 53 Boyden Ave
- 49 Burnett Terrace
- 231 Waverly Place
- 476 Richmond Ave
- 470 Richmond Ave
- 468 Richmond Ave
- 475 Baldwin Rd
- 471 Baldwin Rd
- 479 Baldwin Rd
- 466 Richmond Ave
- 469 Baldwin Rd
- 471 Richmond Ave Unit 473
- 475 Richmond Ave
- 469 Richmond Ave
- 477 Richmond Ave
- 411 Richmond Ave
- 467 Baldwin Rd
- 467 Richmond Ave
- 464 Richmond Ave
- 77 Parker Ave
- 465 Baldwin Rd
- 465 Richmond Ave
- 463 Baldwin Rd