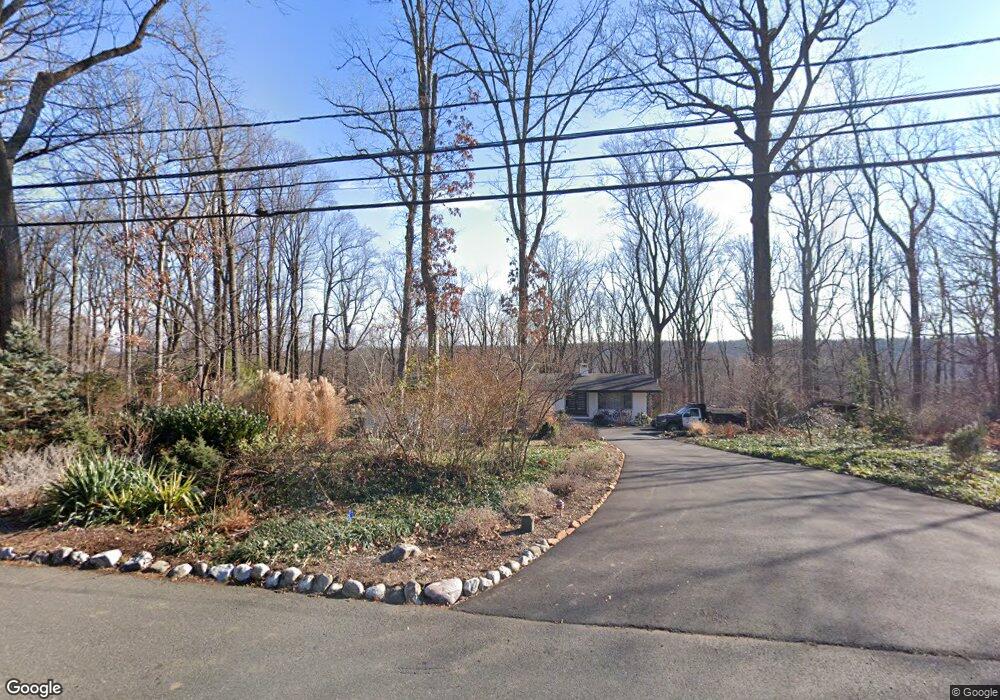
474 Ridge Rd Watchung, NJ 07069
Estimated Value: $988,000 - $1,082,000
--
Bed
--
Bath
2,396
Sq Ft
$430/Sq Ft
Est. Value
About This Home
This home is located at 474 Ridge Rd, Watchung, NJ 07069 and is currently estimated at $1,029,391, approximately $429 per square foot. 474 Ridge Rd is a home located in Somerset County with nearby schools including Bayberry Elementary School, Valley View School, and Watchung Hills Regional High School.
Ownership History
Date
Name
Owned For
Owner Type
Purchase Details
Closed on
Apr 23, 2008
Sold by
Prestera Lillian A
Bought by
Hekler Peter and Sokolova Inna
Current Estimated Value
Home Financials for this Owner
Home Financials are based on the most recent Mortgage that was taken out on this home.
Original Mortgage
$504,000
Outstanding Balance
$309,138
Interest Rate
5.37%
Mortgage Type
Purchase Money Mortgage
Estimated Equity
$720,253
Create a Home Valuation Report for This Property
The Home Valuation Report is an in-depth analysis detailing your home's value as well as a comparison with similar homes in the area
Home Values in the Area
Average Home Value in this Area
Purchase History
| Date | Buyer | Sale Price | Title Company |
|---|---|---|---|
| Hekler Peter | $630,000 | Lawyers Title Insurance Corp |
Source: Public Records
Mortgage History
| Date | Status | Borrower | Loan Amount |
|---|---|---|---|
| Open | Hekler Peter | $504,000 |
Source: Public Records
Tax History Compared to Growth
Tax History
| Year | Tax Paid | Tax Assessment Tax Assessment Total Assessment is a certain percentage of the fair market value that is determined by local assessors to be the total taxable value of land and additions on the property. | Land | Improvement |
|---|---|---|---|---|
| 2025 | $15,311 | $833,000 | $383,600 | $449,400 |
| 2024 | $15,311 | $766,300 | $351,500 | $414,800 |
| 2023 | $14,734 | $721,900 | $328,400 | $393,500 |
| 2022 | $14,501 | $690,200 | $318,900 | $371,300 |
| 2021 | $13,589 | $669,400 | $311,100 | $358,300 |
| 2020 | $14,004 | $658,100 | $305,000 | $353,100 |
| 2019 | $13,589 | $654,900 | $305,000 | $349,900 |
| 2018 | $12,848 | $645,300 | $296,100 | $349,200 |
| 2017 | $12,412 | $627,200 | $262,000 | $365,200 |
| 2016 | $12,891 | $616,500 | $262,000 | $354,500 |
| 2015 | $12,325 | $581,900 | $238,100 | $343,800 |
| 2014 | $11,959 | $571,100 | $238,100 | $333,000 |
Source: Public Records
Map
Nearby Homes
- 14 High Tor Dr
- 221 Old Somerset Rd
- 999 Drift Rd
- 32 Berkeley Square
- 85 Appletree Row
- 115 Old Somerset Rd
- 220 Horseshoe Rd
- 90 Century Ln
- 53 Canterbury Ln
- 12 Mareu Dr
- 37 Oak Ridge Rd
- 566 Plainfield Ave
- 221 Myrtle Rd
- 127 Myrtle Rd
- 204 Honeysuckle Ln
- 104 Myrtle Rd Unit 1312
- 208 Myrtle Rd Unit 1324
- 177 Jasmine Dr Unit 1214
- 179 Jasmine Dr Unit 1215
- 275 Jasmine Dr Unit 1223