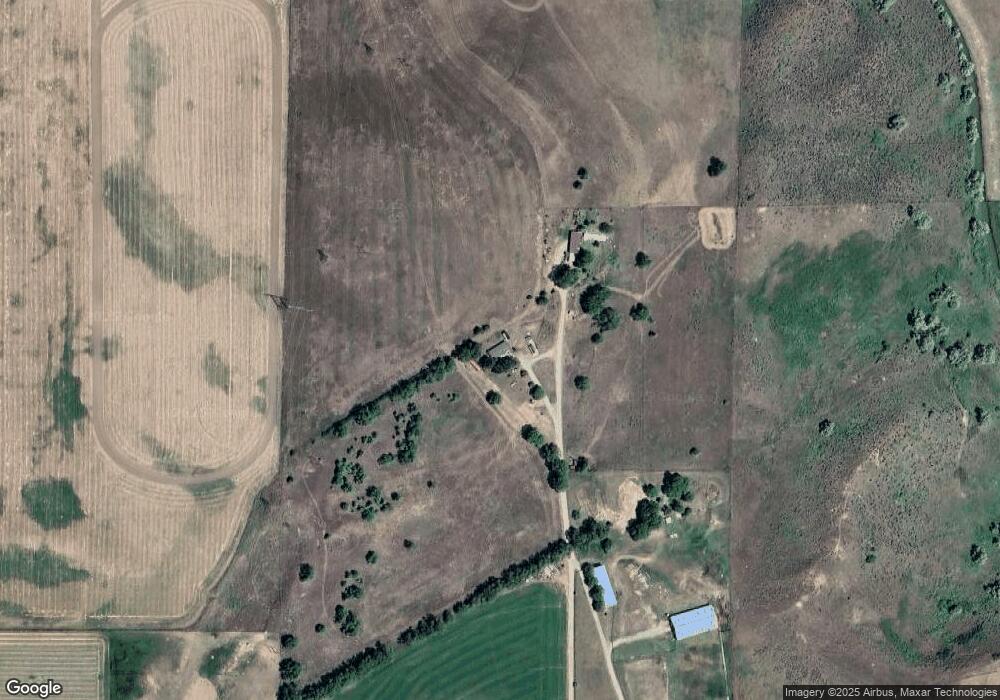
474 S 2600 W Weston, ID 83286
Estimated Value: $316,457 - $413,000
3
Beds
1
Bath
1,344
Sq Ft
$269/Sq Ft
Est. Value
About This Home
This home is located at 474 S 2600 W, Weston, ID 83286 and is currently estimated at $361,864, approximately $269 per square foot. 474 S 2600 W is a home located in Franklin County with nearby schools including Harold B. Lee Elementary School, Harold B. Lee Middle School, and West Side Senior High School.
Ownership History
Date
Name
Owned For
Owner Type
Purchase Details
Closed on
Feb 22, 2022
Sold by
Creager Wayne M and Revo Adele
Bought by
Creager Jon P and Creager Katherine
Current Estimated Value
Purchase Details
Closed on
Nov 4, 2015
Sold by
Creager Wayne M and Creager Adele L
Bought by
The 1999 Wayne M Creager And Adele L Cre
Purchase Details
Closed on
Dec 10, 2008
Sold by
Creager Joh P and Creager Katherine F
Bought by
Creager Wayne M and Creager Adele L
Home Financials for this Owner
Home Financials are based on the most recent Mortgage that was taken out on this home.
Original Mortgage
$83,500
Interest Rate
6.47%
Mortgage Type
New Conventional
Create a Home Valuation Report for This Property
The Home Valuation Report is an in-depth analysis detailing your home's value as well as a comparison with similar homes in the area
Home Values in the Area
Average Home Value in this Area
Purchase History
| Date | Buyer | Sale Price | Title Company |
|---|---|---|---|
| Creager Jon P | -- | None Listed On Document | |
| The 1999 Wayne M Creager And Adele L Cre | -- | None Available | |
| Creager Wayne M | -- | -- |
Source: Public Records
Mortgage History
| Date | Status | Borrower | Loan Amount |
|---|---|---|---|
| Previous Owner | Creager Wayne M | $83,500 |
Source: Public Records
Tax History Compared to Growth
Tax History
| Year | Tax Paid | Tax Assessment Tax Assessment Total Assessment is a certain percentage of the fair market value that is determined by local assessors to be the total taxable value of land and additions on the property. | Land | Improvement |
|---|---|---|---|---|
| 2024 | $1,435 | $242,890 | $60,000 | $182,890 |
| 2023 | $1,230 | $197,495 | $60,000 | $137,495 |
| 2022 | $1,225 | $174,420 | $35,000 | $139,420 |
| 2021 | $761 | $159,912 | $35,000 | $124,912 |
| 2019 | $737 | $127,104 | $35,000 | $92,104 |
| 2018 | $718 | $117,992 | $27,500 | $90,492 |
| 2017 | $738 | $117,992 | $27,500 | $90,492 |
| 2016 | $693 | $102,440 | $27,500 | $74,940 |
| 2015 | $681 | $102,440 | $27,500 | $74,940 |
| 2014 | $11,121 | $106,620 | $27,500 | $79,120 |
| 2013 | $9,810 | $99,280 | $27,500 | $71,780 |
Source: Public Records
Map
Nearby Homes