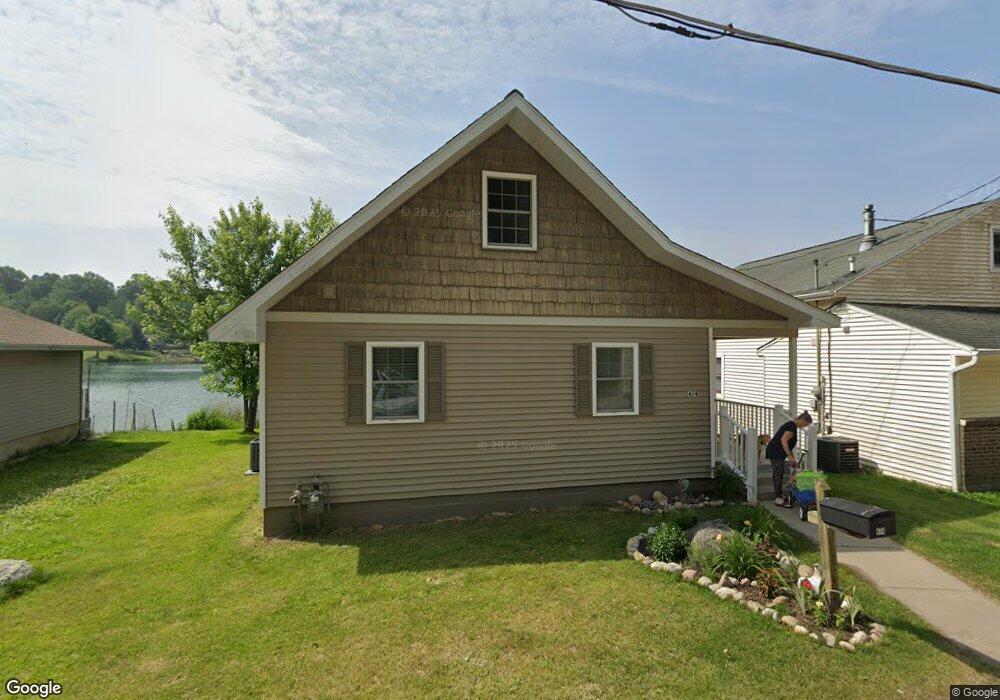
474 S Shore Dr Unit A Caledonia, MI 49316
Estimated Value: $283,846 - $482,000
3
Beds
1
Bath
1
Sq Ft
$384,962/Sq Ft
Est. Value
About This Home
This home is located at 474 S Shore Dr Unit A, Caledonia, MI 49316 and is currently estimated at $384,962, approximately $384,962 per square foot. 474 S Shore Dr Unit A is a home located in Allegan County with nearby schools including Caledonia Elementary School, Emmons Lake Elementary School, and Dutton Elementary School.
Ownership History
Date
Name
Owned For
Owner Type
Purchase Details
Closed on
Nov 1, 2023
Sold by
Peters Michael Scott
Bought by
Newhouse Cynthia G
Current Estimated Value
Purchase Details
Closed on
Sep 17, 2002
Sold by
Hud
Bought by
Peters Michael S
Purchase Details
Closed on
Dec 27, 2001
Sold by
Chase Manhattan Mtg Corp
Bought by
Hud
Purchase Details
Closed on
Nov 1, 2001
Sold by
Chachulski Michael S and Chachulski Miranda M
Bought by
Chase Manhattan Mtg Corp
Purchase Details
Closed on
Oct 22, 1999
Bought by
Chachulski Michael and Chachulski Miranda
Purchase Details
Closed on
Oct 21, 1999
Bought by
Chachulski Mike and Chachulski Miranda
Purchase Details
Closed on
Apr 16, 1998
Sold by
Vos Albert J
Bought by
Contimortgage Corporation
Create a Home Valuation Report for This Property
The Home Valuation Report is an in-depth analysis detailing your home's value as well as a comparison with similar homes in the area
Home Values in the Area
Average Home Value in this Area
Purchase History
| Date | Buyer | Sale Price | Title Company |
|---|---|---|---|
| Newhouse Cynthia G | $345,000 | Star Title | |
| Newhouse Cynthia G | $345,000 | Star Title | |
| Peters Michael S | $120,195 | -- | |
| Hud | -- | -- | |
| Chase Manhattan Mtg Corp | $107,142 | -- | |
| Chachulski Michael | $100,000 | -- | |
| Chachulski Mike | $100,000 | -- | |
| Contimortgage Corporation | -- | -- |
Source: Public Records
Tax History Compared to Growth
Tax History
| Year | Tax Paid | Tax Assessment Tax Assessment Total Assessment is a certain percentage of the fair market value that is determined by local assessors to be the total taxable value of land and additions on the property. | Land | Improvement |
|---|---|---|---|---|
| 2025 | $3,224 | $102,400 | $32,100 | $70,300 |
| 2024 | $2,346 | $96,300 | $32,100 | $64,200 |
| 2023 | $2,346 | $90,500 | $32,100 | $58,400 |
| 2022 | $2,346 | $78,900 | $28,600 | $50,300 |
| 2021 | $2,202 | $72,300 | $26,200 | $46,100 |
| 2020 | $2,178 | $69,100 | $26,200 | $42,900 |
| 2019 | $2,131 | $67,200 | $26,200 | $41,000 |
| 2018 | $2,054 | $66,000 | $24,600 | $41,400 |
| 2017 | $0 | $64,200 | $24,600 | $39,600 |
| 2016 | $0 | $62,000 | $24,600 | $37,400 |
| 2015 | -- | $62,000 | $24,600 | $37,400 |
| 2014 | -- | $61,100 | $24,600 | $36,500 |
| 2013 | $2,159 | $58,900 | $24,600 | $34,300 |
Source: Public Records
Map
Nearby Homes
- 495 Round Lake Dr
- 4525 Mesa Ct SE
- 433 Dolphin St
- 4626 Hilltop Dr
- 446 Bayview Ct
- Lot 158 Wren Dr SE
- 4440 Sunrise Trail
- 4632 Wren Dr SE
- 259 Warbler Dr SE
- 5614 Pioneer Pass Unit 1
- 166 Wren Ct
- Bayberry Plan at Paris Ridge
- Freedom Plan at Paris Ridge
- Charlotte Plan at Paris Ridge
- Karolynn Plan at Paris Ridge
- Oxford Plan at Paris Ridge
- Sierra Plan at Paris Ridge
- Hampton Plan at Paris Ridge
- Reno Plan at Paris Ridge
- London Plan at Paris Ridge
- 474 S Shore Dr
- 474 S Shore Dr
- 476 S Shore Dr
- 470 S Shore Dr
- 480 S Shore Dr
- 480 145th Ave
- 482 S Shore Dr
- 484 S Shore Dr
- 484 S Shore Dr
- 466 S Shore Dr
- 466 S Shore Dr Unit A
- 488 S Shore Dr
- 489 S Shore Dr
- 492 145th Ave
- 492 S Shore Dr
- 4501 E Shore Dr
- 494 145th Ave
- 494 S Shore Dr
- 4498 E Shore Dr
- 498 S Shore Dr